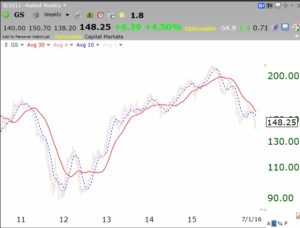
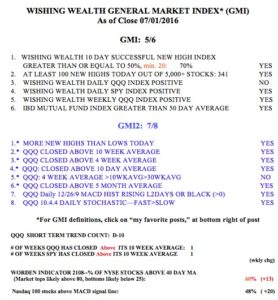
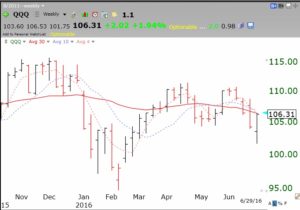
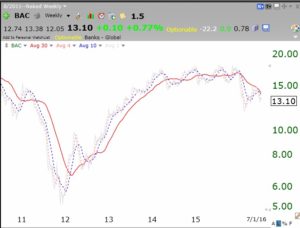
It has been a wild ride with the GMI signals reversing quickly from Sell to Buy. I like to give my signals a few days after a change before I act on them. So I will watch mainly from the sidelines for a while. I am very concerned about the down-trends in many bank stocks. Look at this “naked” chart of the 4,10, and 30 week (red line) averages for GS, a leader in the financial area. The gray solid line is the weekly close, currently leading the other averages lower.
Most of the major banks have emerging down-trends like GS. Here is BAC.
 And then there is the ugly AAPL chart.
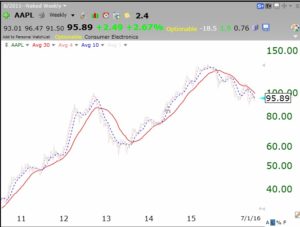 Once charts top out, one never knows where the bottom will be. At least for now, these charts indicate to me stormy weather ahead for this market and maybe the economy. And then there is strengthening gold, GLD, perhaps reflecting fear and a weakening dollar.
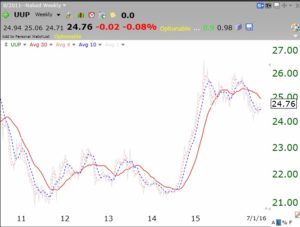
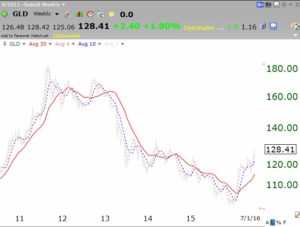 Here is the dollar ETF, UUP. Its 30 week average has topped out.
And the GMI is now 5 (of 6) and signalling Buy!?
