Green Line Breakout (GLB)
I draw a green line on a monthly stock chart at a bar at an all-time high that has not been penetrated (or closed above) for three straight months (or 3 bars). It basically is a strong stock breaking out to an all-time high (ATH) after at least a 3-month consolidation. Green line breakout stocks, in my experience, often go on to make a series of new highs as they rocket toward the moon.
EasyScans
(Each TC2000 EasyScan produces a list of stocks that pass a set of filters) These lists are for educational purposes only and stocks that are identified require additional study and research. (In some instances I may slightly modify these scans without changing the definition below. ) TC2000 no longer supports clubs, so you may not access these directly.
- 10152016LBBbounceFstoch>slowhisup This scan finds all US common stocks that bounced from the lower 15.2 daily lower Bollinger band and the 10.4 daily stochastic > 10.4.4 daily stochastic and the daily MACD 12.26.9 histogram is rising and the 10wk average>30 wk average and the 30 day average is > 30 day average 3 days ago and 90 day average daily volume>100000 and 10.4 daily stochastic <60 and stock price>10. It is designed to find stocks possibly bouncing up off of support (BOS).
- DARVAS This is my attempt to find stocks that Nicolas Darvas sought. Find all US common stocks that are within 20% of their 52 week high and had earnings per share latest quarter up >20% and a price >30 and current day’s volume >100000 and has doubled in the past year or past 100 days and 4 week average>10 wk avg>30wk avg and recent % change in revenue>0.
- 10092016RWBbounce10wk>80 Find all US common stocks with 4 week avg>10wk avg>30wk avg and just bounced up above its 10 week avg and price >80 and close/close 5 days ago between 1-100 (eliminates nonmovers) and 90 day avg volume> 100000 and has a perfect RWB (red white and blue, see definition in glossary) pattern.
- 10222012Submarine Finds all US common stocks with 4wk avg <10wk avg <30wk avg and price >70 and options available. This help me to find stocks that are topping put and may be suitable for shorting.
- 11132016ATHweeklygainhivol Finds stocks on my Alltimehighs WatchList (see definition above) that closed this week higher than the prior week on above average volume.
- 11262016weeklyconsolbrkout Fins US common stocks that broke out from a recent consolidaiton and had recent quarterly earnings up >+50%.
- 10152016LBBbounceFstoch>slowhisup Find US stocks with a lower daily 15.2 Bollinger Band bounce and daily 10.4 stochastic>10.4.4 stochastic and daily MACD histogram rising and 10 wk avg > 30 wk avg and 30 day avg is rising and 90 day avg vol > 100000 and daily stochastic <60 and price >10.
- 11252016Hivolwklycloseup Finds stocks in my Alltimehighs WatchList (see definition above) with weekly close up on high volume and close> 30 wk avg and price > 5 and latest quarterly earnings up > +50% and 10wk avg > 30 wk avg and close is more than 50% higher than lowest price in past year and close is up > +25% from a year ago.
- 12102016Up15%l50dstochbounce-Copy Finds US common stocks with daily 10.4 stochastic>10.4.4 stochastic and highest price up at least 15% above lowest price in last 50 days and last day’s volume >100000.
- 01292017ATHhipast40daysBLBB Scans my Alltimehigh WatchList (see definition above) for stocks that hit a new high in the past 40 days and have bounced from their lower 15.2 daily Bollinger Band.
- 02112017Up150%last250days100DHi US stocks trading 1.5 times price 250 days ago and >$10 with today’s volume >50,000 shares that is in a strong RWB pattern (see definition above) that hit a 100 day high today but not yesterday and with today’s volume >110% of avg daily volume last 50 days. Note that the way TC2000 formula’s work, any stock that does not have 250 days of data will not be selected by this scan.
- 03182017RWBdailyresumeuptrend Scans my Alltimehigh WatchList (see definition above) for stocks with a Stochastics value<50 on any of past 5 days, with the close and all 12 exponential averages lined up perfectly (each average is above next longer average) and today’s volume>100,000 and its relative strength vs. SPY is above its 30 day average of relative strength vs. SPY. It also requires today’s close>yesterday’s close and price>15. To ensure an established RWB pattern, the daily exponential average of close over 3 days must be> exp avg of close over 30 days for the past 20 days.
- 12162017RWBBounce Scans all US stocks for those where: it closed in last 5 days below all 6 red short averages and has now closed above all 6; there is a space between the red and blue averages; all 12 averages line up with each one above the next longer average; the 10.4 fast daily stochastic is above the 10.4.4 slow daily stochastic; the stock is moe than 80% above its lowest price in the last 250 days.
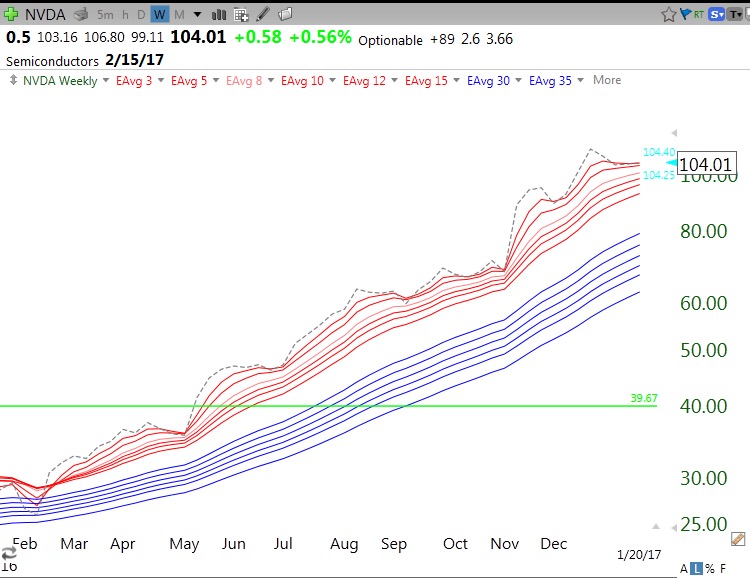
RWB (red white and blue) pattern
This is the term I use for plots that produce a pattern with 6 red shorter term exponential weekly (or daily) averages rising above 6 longer term weekly (or daily) exponential averages such that there remains a white space between the two sets of averages. This assumes a chart with a white background. The 6 shorter term exponential averages are 3,5,8,10,12,15 weeks and the longer term exponential averages are 30,35,40, 45,50,60 weeks. I also add a 13th dotted line that shows the close each week (or day). A strong rocket pattern has all averages lined up with each average rising above the next longer average and the weekly closes above all 12 average leading them higher.
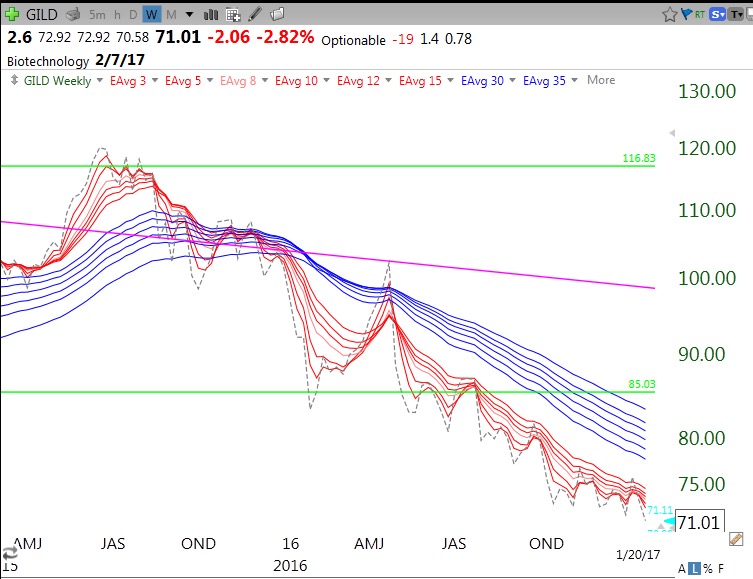
BWR (blue white and red) pattern
This is the opposite of the RWB pattern (see definition) and shows all shorter term averages declining below the longer term averages. These are the types of stocks I might short.
RLC (red line count)
The RLC is based on an RWB daily chart. It is a count of the close compared with each of the six red lines (shorter moving averages). If the equity is above all 6 averages, then RLC=6. If it is below all of them RLC=0. I like to buy equities with an RLC=6. Many rising stocks can go for long periods with the close leading all of the red lines higher. If RLC falls to 0, I might reduce or eliminate my position. RLC appears on my charts at the end of the second line from the top. (It is not visible on the charts above.)