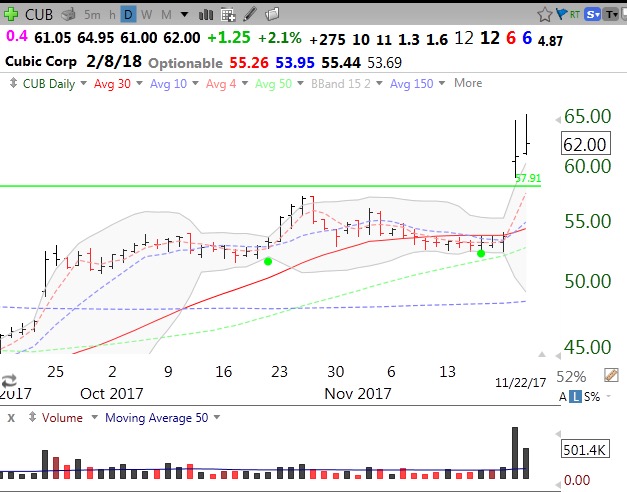
If you take a look at the GLB tracker table on this page you will see that stocks that closed above their green line (drawn at all time high not surpassed for at least 3 months) sometimes perform very well. I have no idea what percentage of GLB stocks continue to rise. If a stock closes back below its green line I exit immediately. Anyway, below are 18 stocks that had a GLB in the past 2-3 weeks that also had last quarterly earnings up at least +25%. I copied the last quarter’s earnings increase, taken from TC2000, in the second column. These are stocks to watch (I own a few).

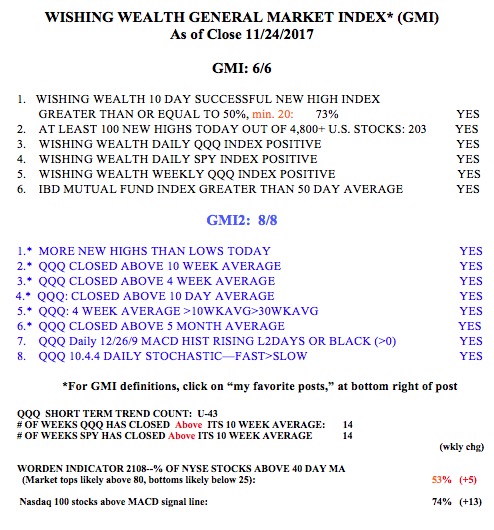
The GMI remains at 6 (of 6) and on day 43 (U-43) of the QQQ short term up-trend.