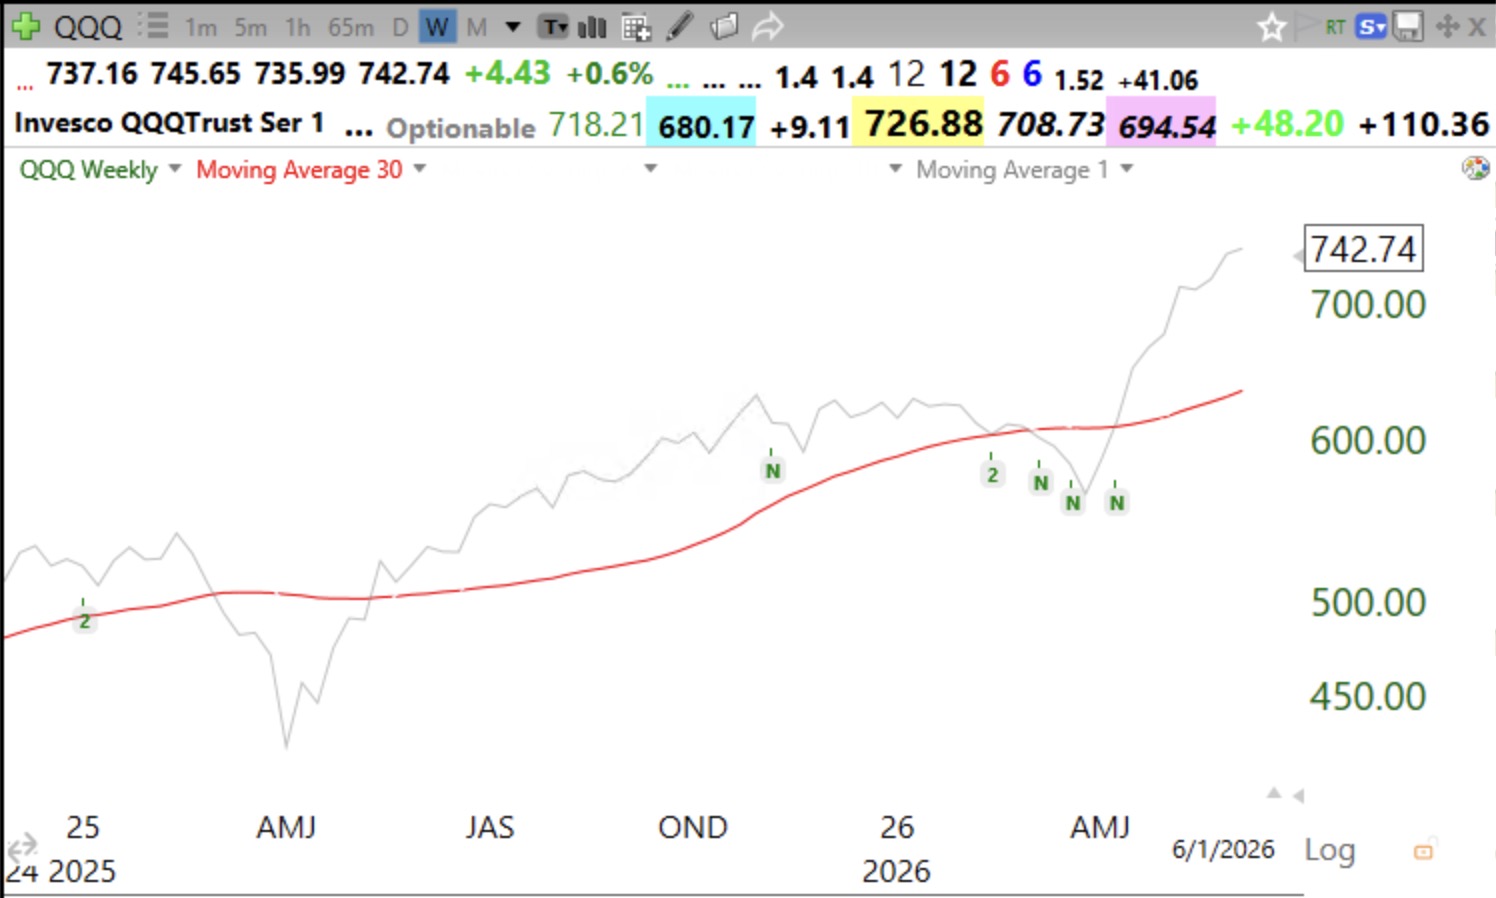
This signal helped me to get out at the beginning of of all major declines since 2000. Here are the 2000 top and today’s chart. Gray line is weekly price closes. Thank you Stan Weinstein for teaching me stage analysis.
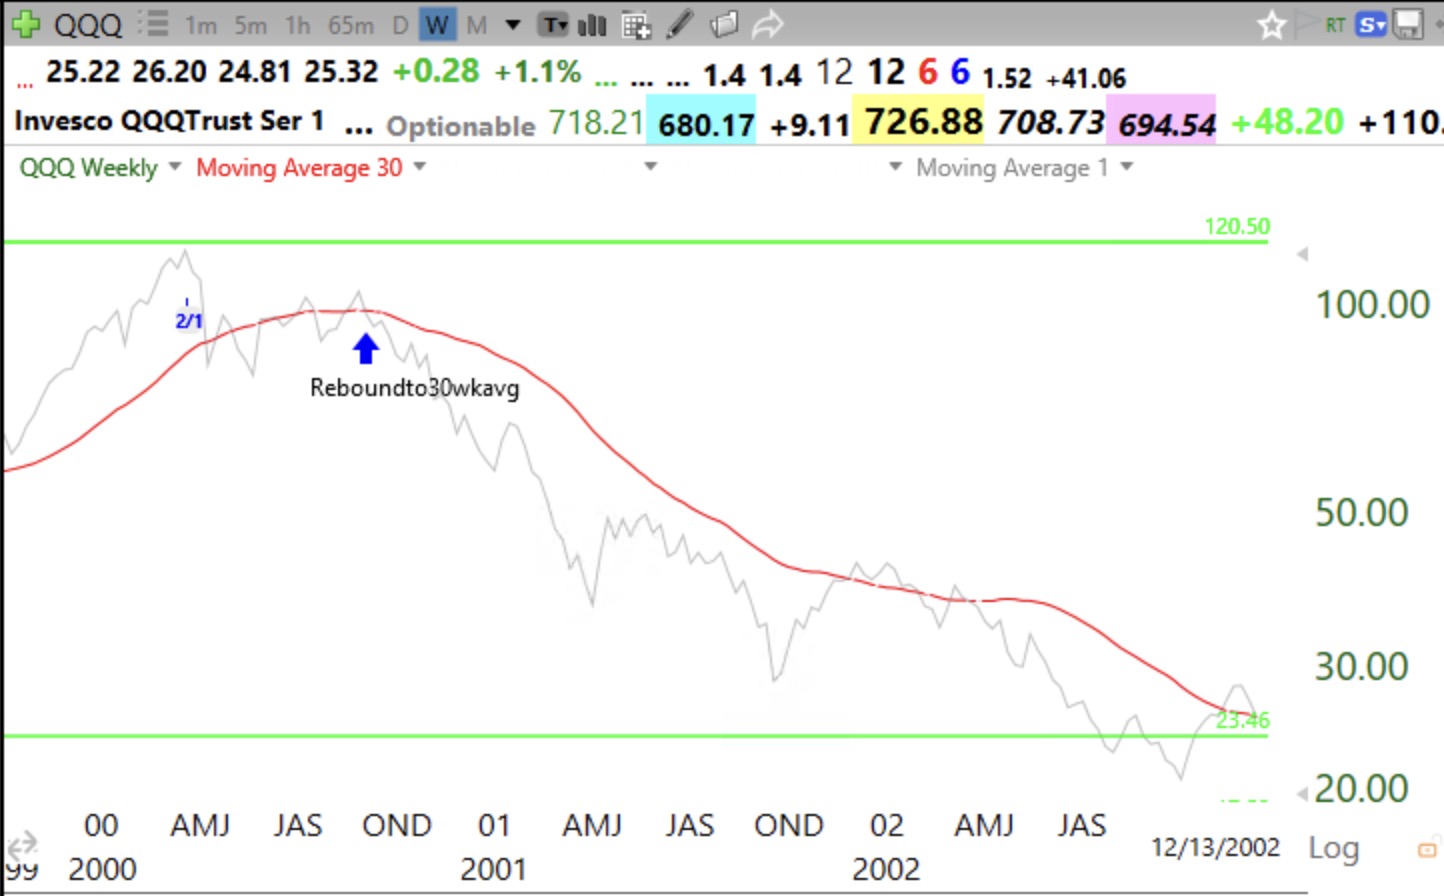
I got defensive in April 2025 until the 30 week resumed its rise. Compare these two charts. See a top?
Hi Dr. Wish – It sounds like the 10 wk cross 30 wk and the 30 wk curving down were key to getting out, but may have come later. Did climax top rules play any role for you? I’ve been following you a long time and long since followed IBD per your notes — it feels like many conditions are being currently met. I’d love your take though. https://shop.investors.com/images/promotional/ClimaxTop_Booklet.pdf