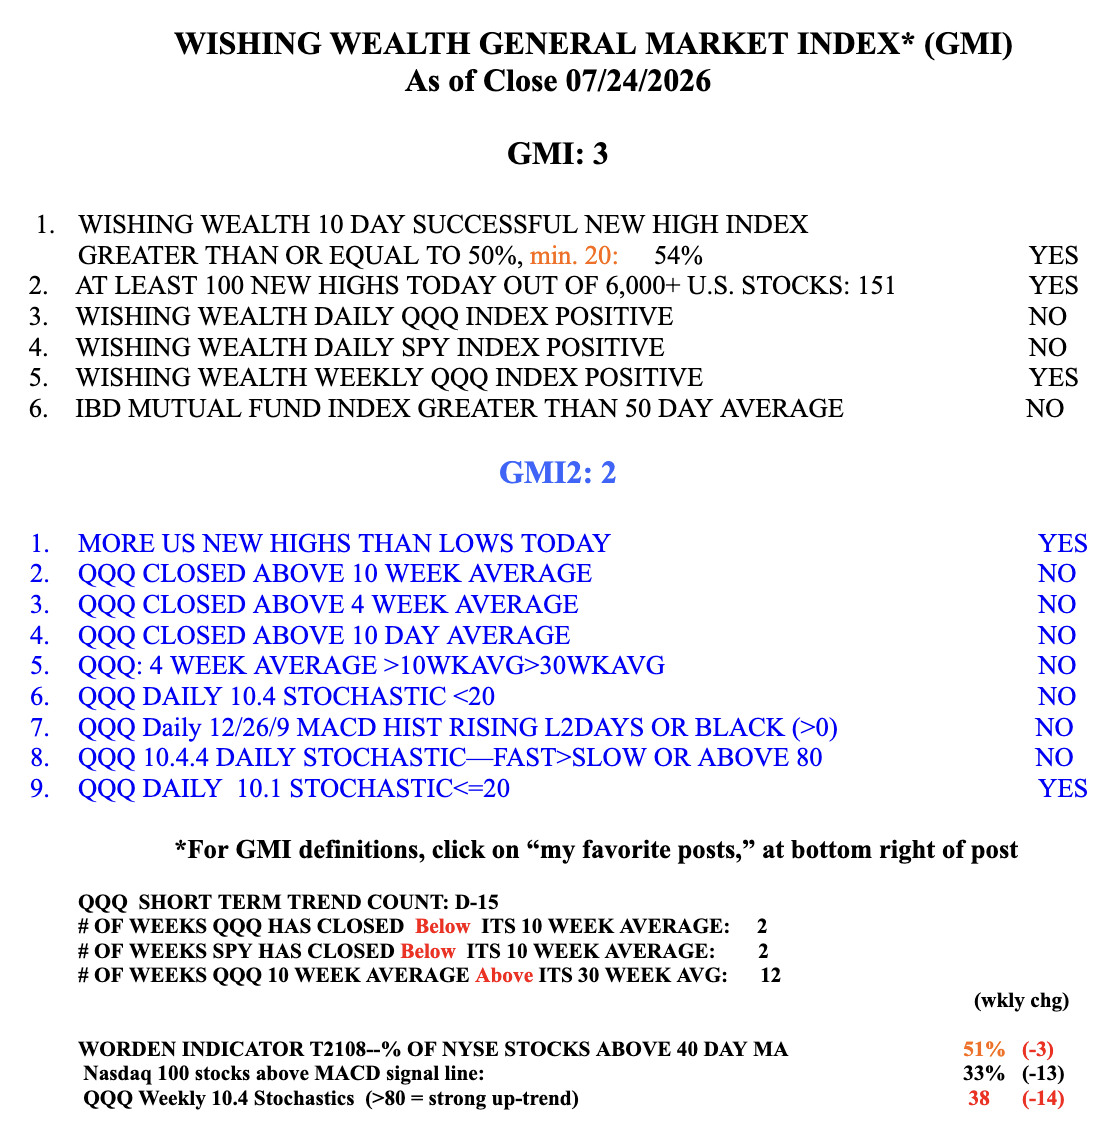
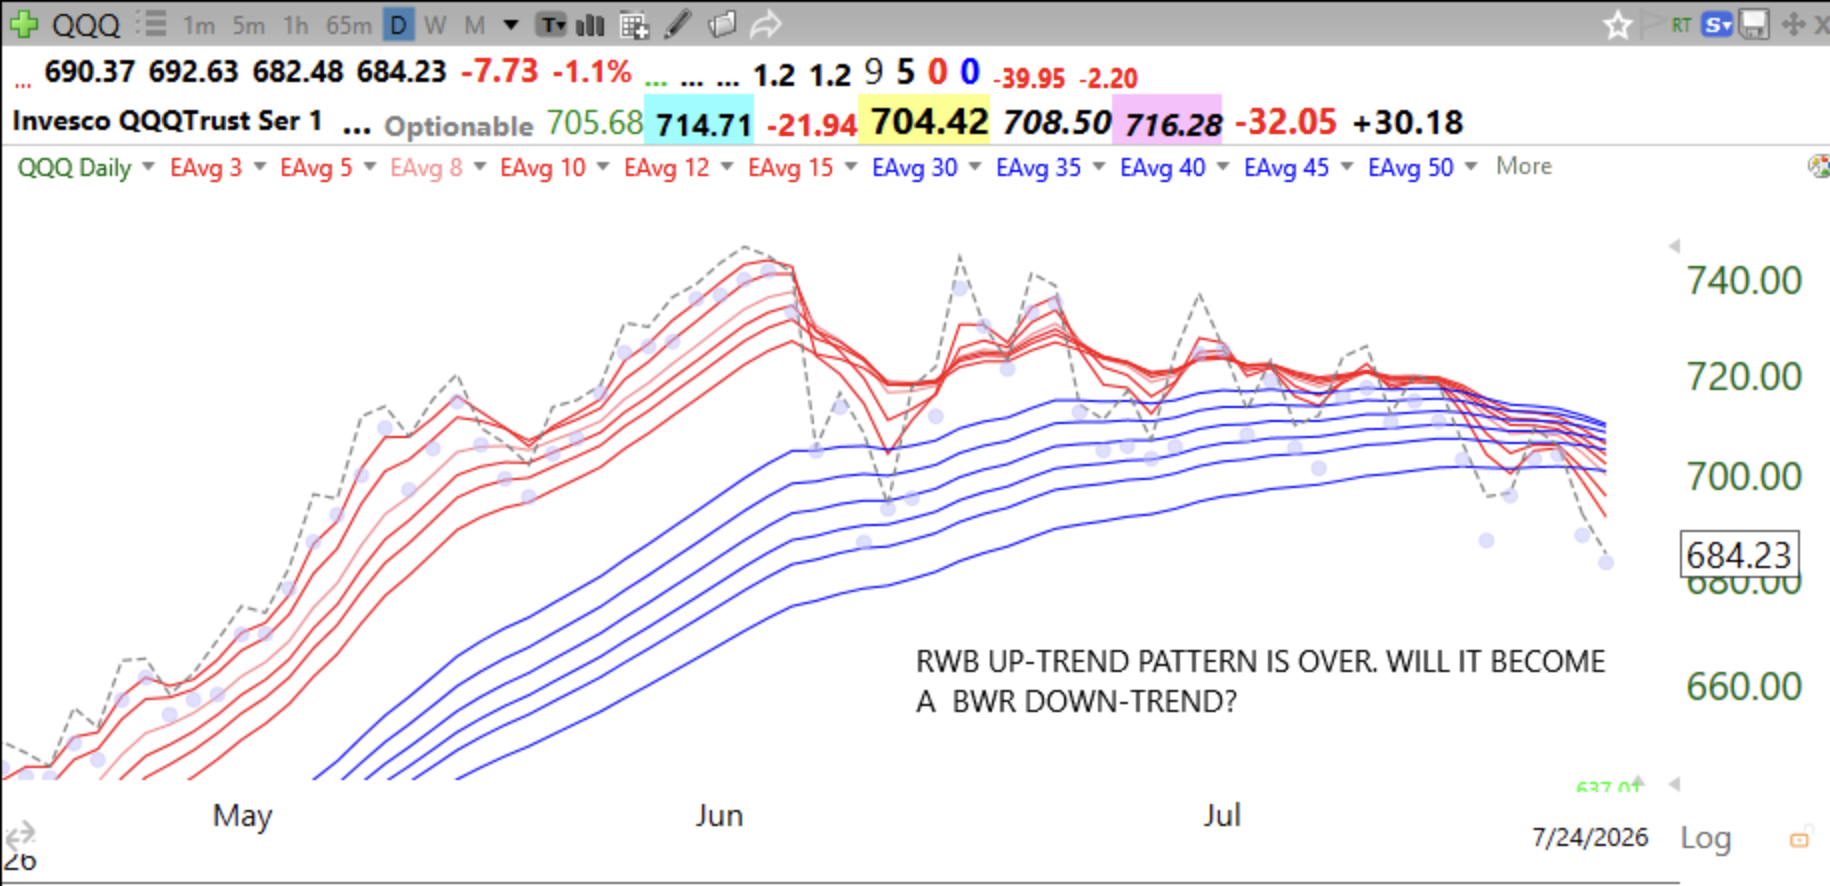
Modified Guppy chart tells the story. Best time to trade QQQ type stocks is when the index is in a RWB up-trend with all Red shorter term averages climbing well above the Blue longer term averages with a White space between them. The RWB pattern was evident from mid-April to early June and trading break-outs in tech stocks worked very well for me. The dotted line shows the daily closes. In a solid up-trend it leads all of the averages higher. The dotted line is now declining below all of the averages. When we get a close above all of the averages, and a RWB, we might see a meaningful change in trend.The market’s behavior reveals all.
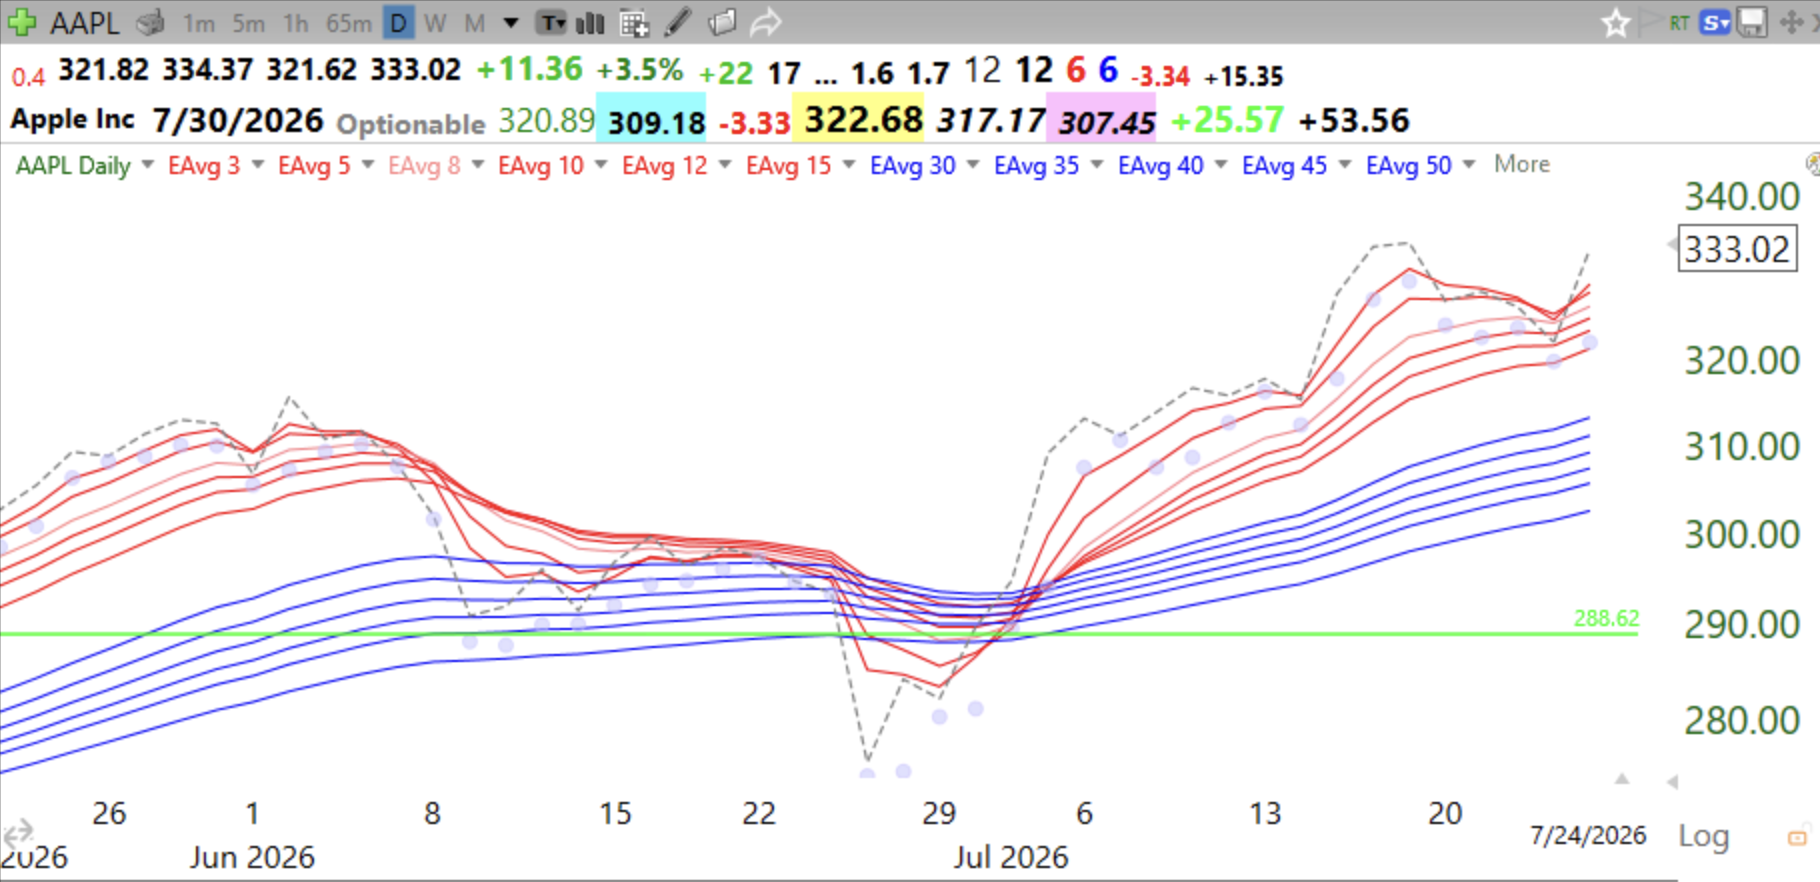
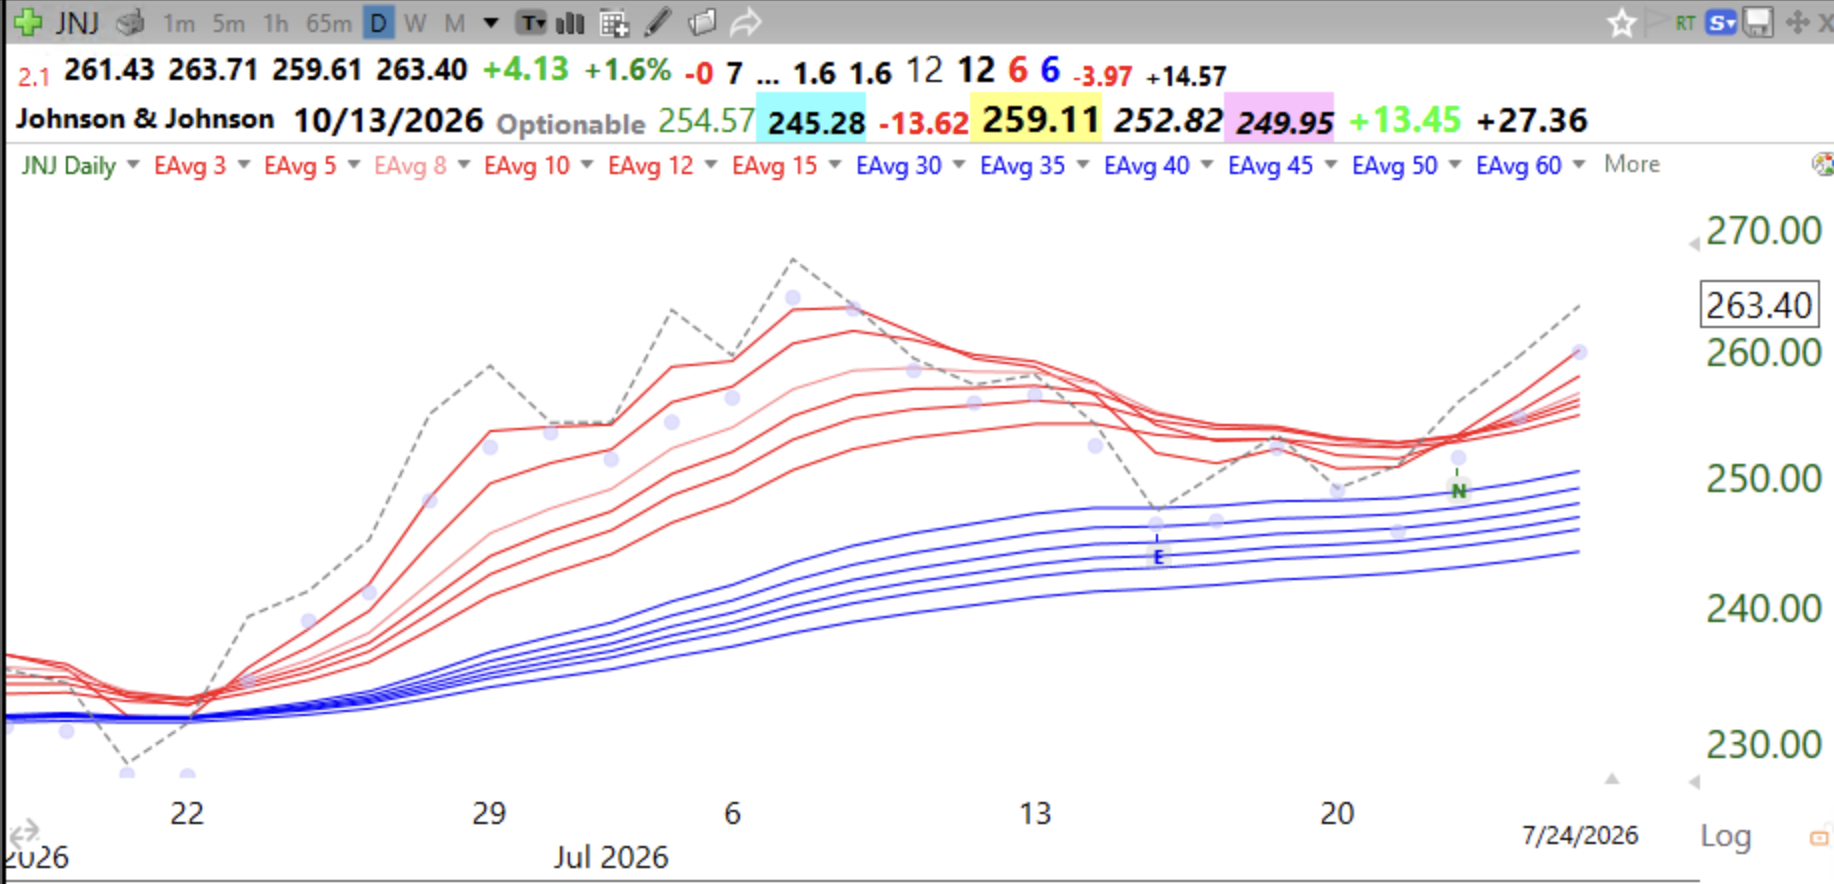
Modified Guppy charts also work for stocks!! Before I buy or sell, I always check out the modified daily Guppy charts.