You can see my MoneyShow presentation here. I explain GLBs, blue dot signals and Guppy charts.
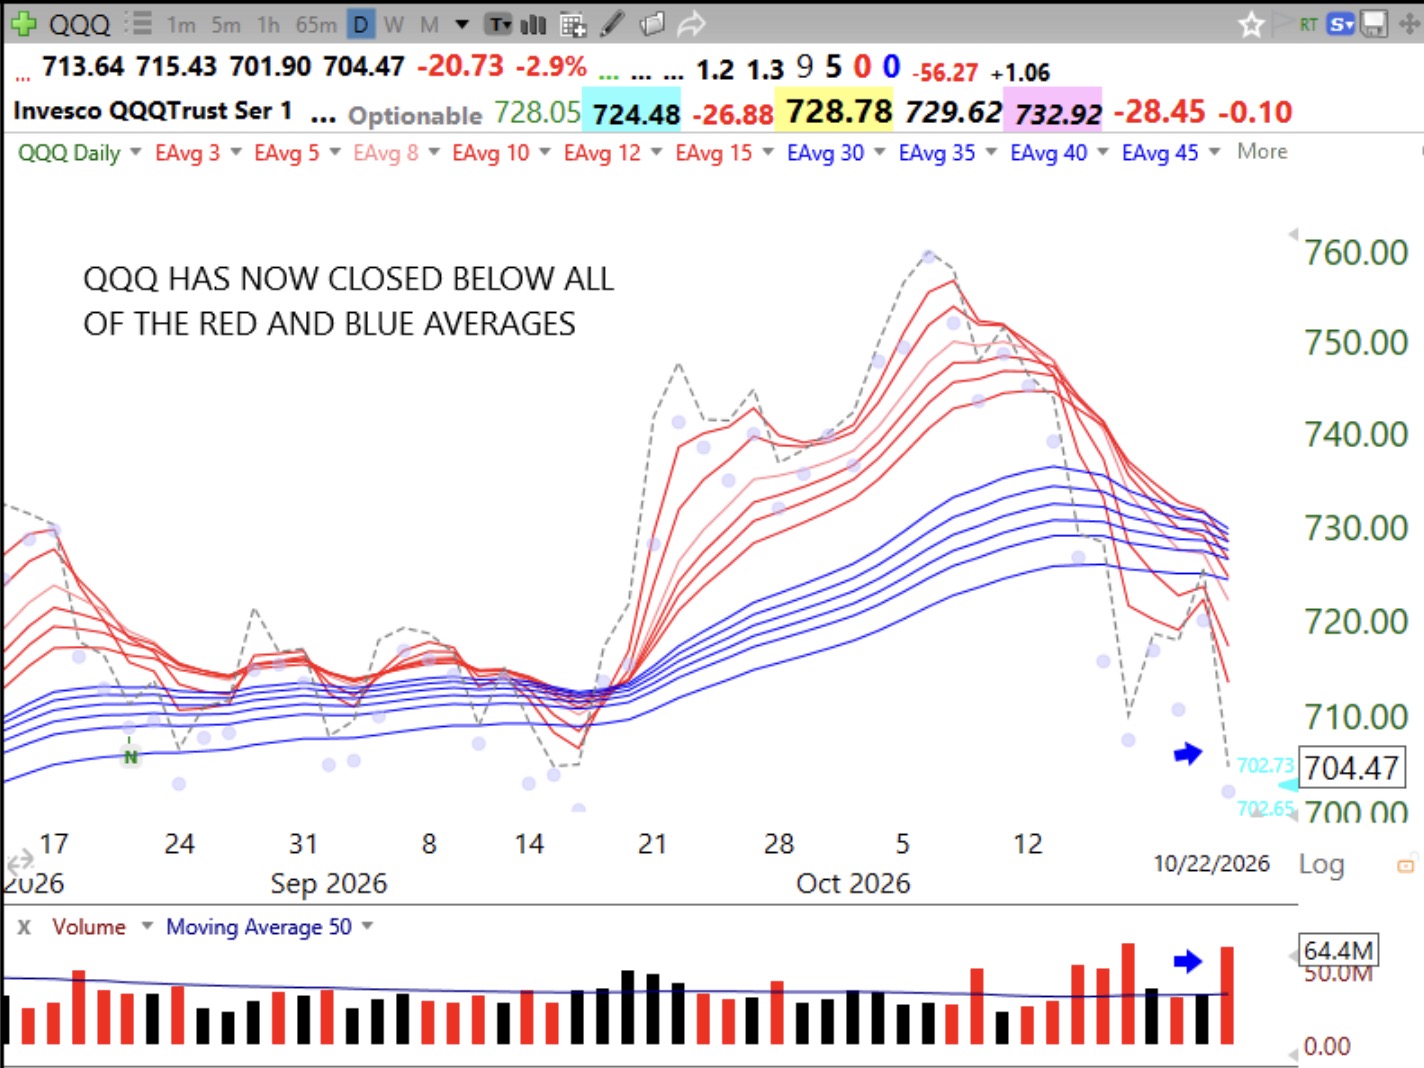
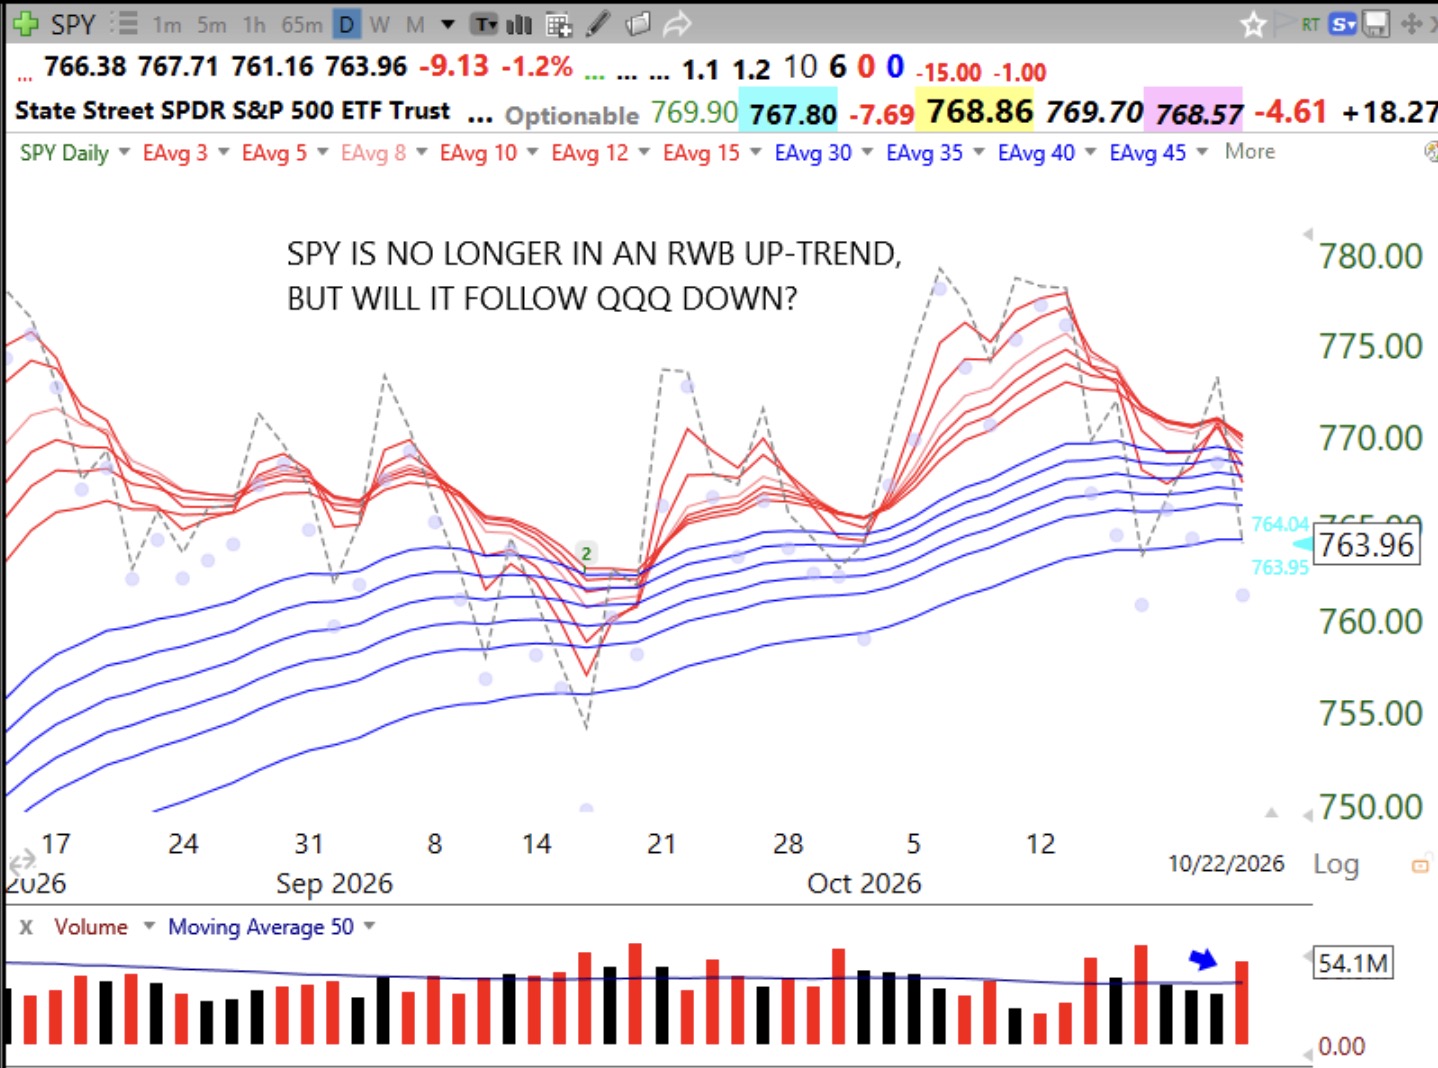
The GMI=1, only because there were more than 100 new highs. Compare the modified Guppy charts for QQQ and SPY.
Stock Market Technical Indicators & Analysis
You can see my MoneyShow presentation here. I explain GLBs, blue dot signals and Guppy charts.
The GMI=1, only because there were more than 100 new highs. Compare the modified Guppy charts for QQQ and SPY.