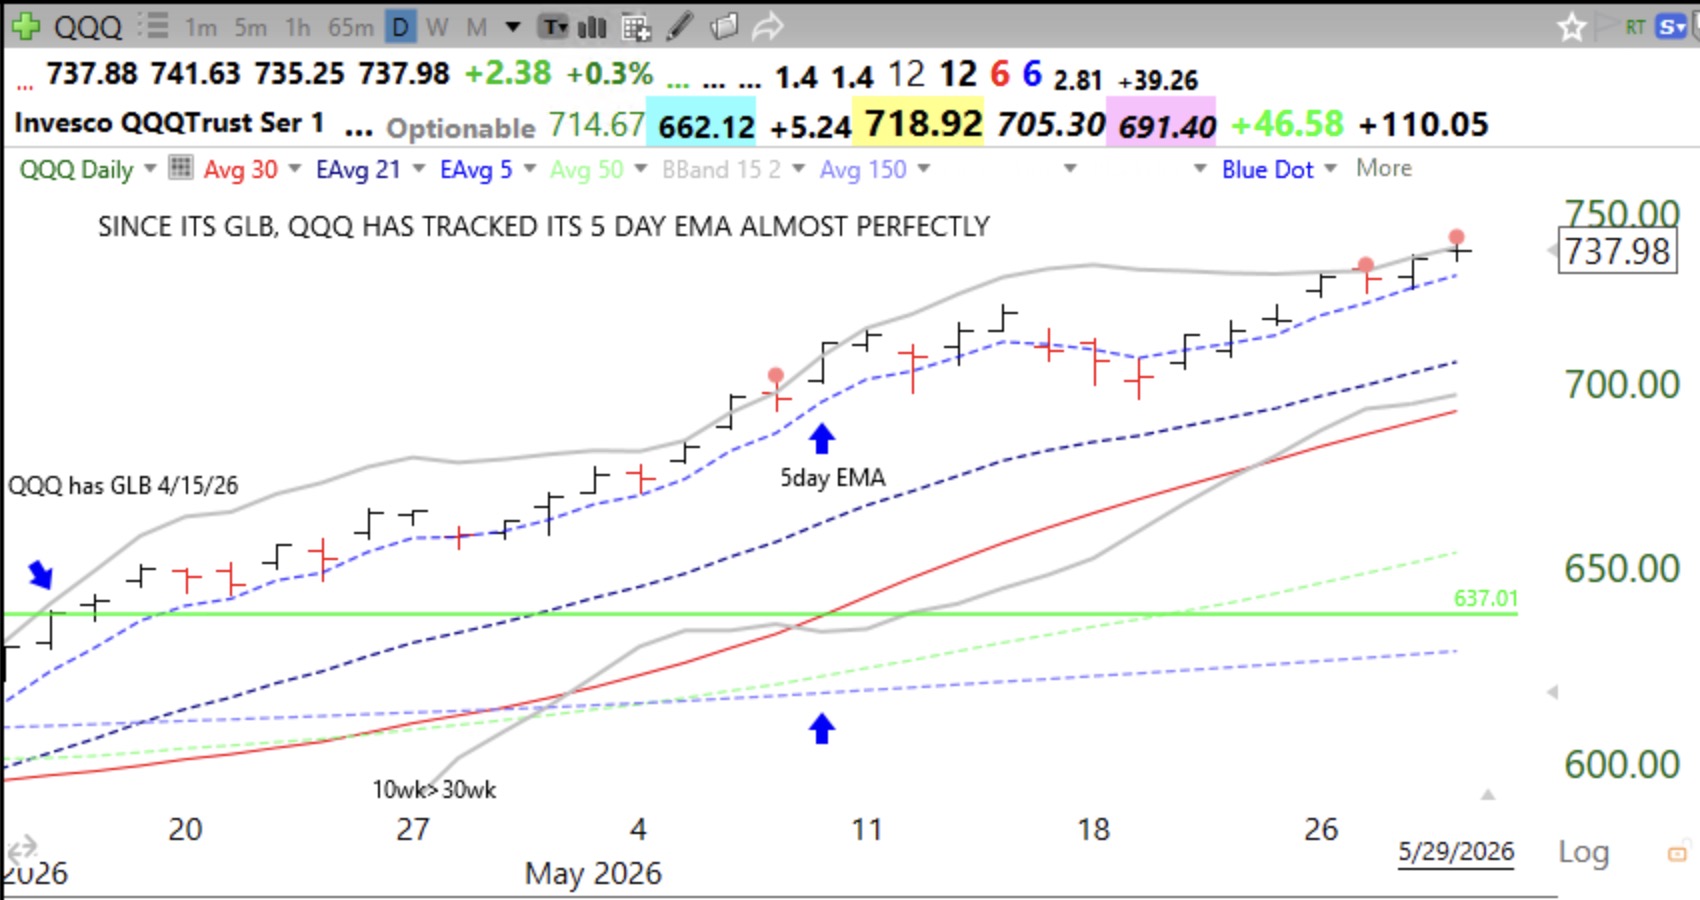
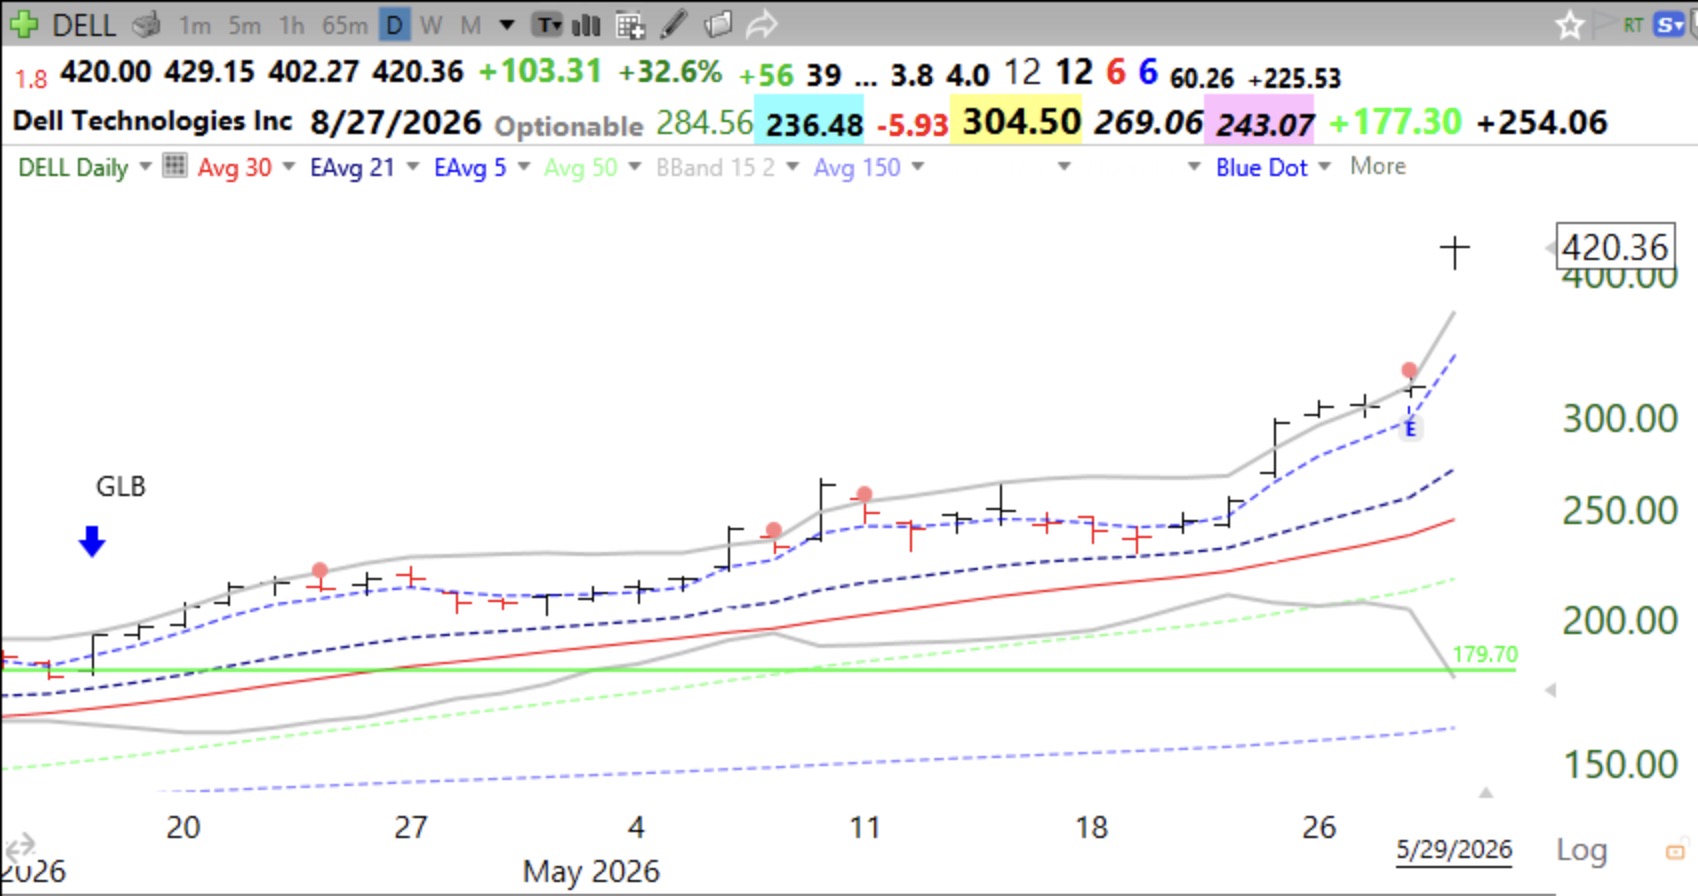
One can design steups for trading based on the 5 day EMA. The 5 day EMA> 21 day EMA > 30 day SMA and ? Look at this chart and create your rules. I may look for bounces up off of the rising 5DEMA. See these daily charts of QQQ and DELL.
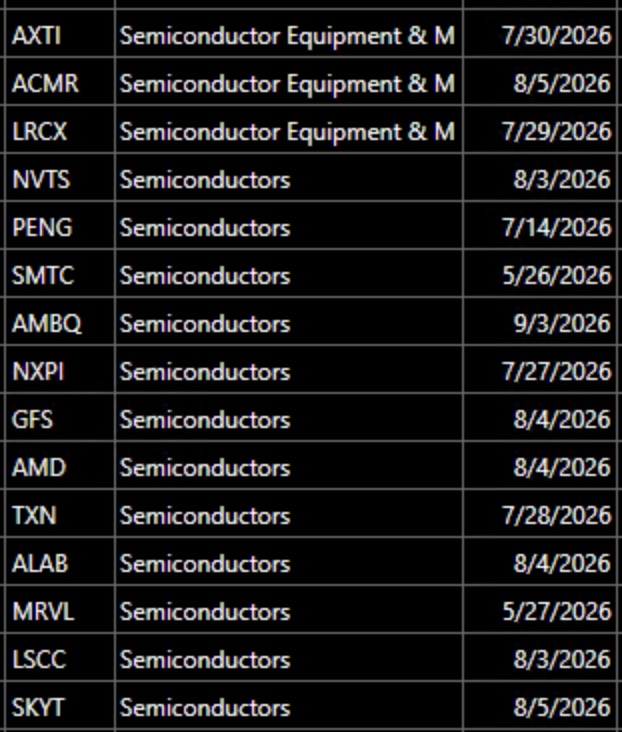
Theses 15 stocks traded at an ATH (all-time high) on Friday. Five had a GLB last week: NVTS, NXPI, GFS, ALAB, SKYT. Check them out and draw in their green lines according to the rules I specified at my recent presentation to the MoneyShow. Any that CLOSE below their green line, I would consider to be a failed GLB.
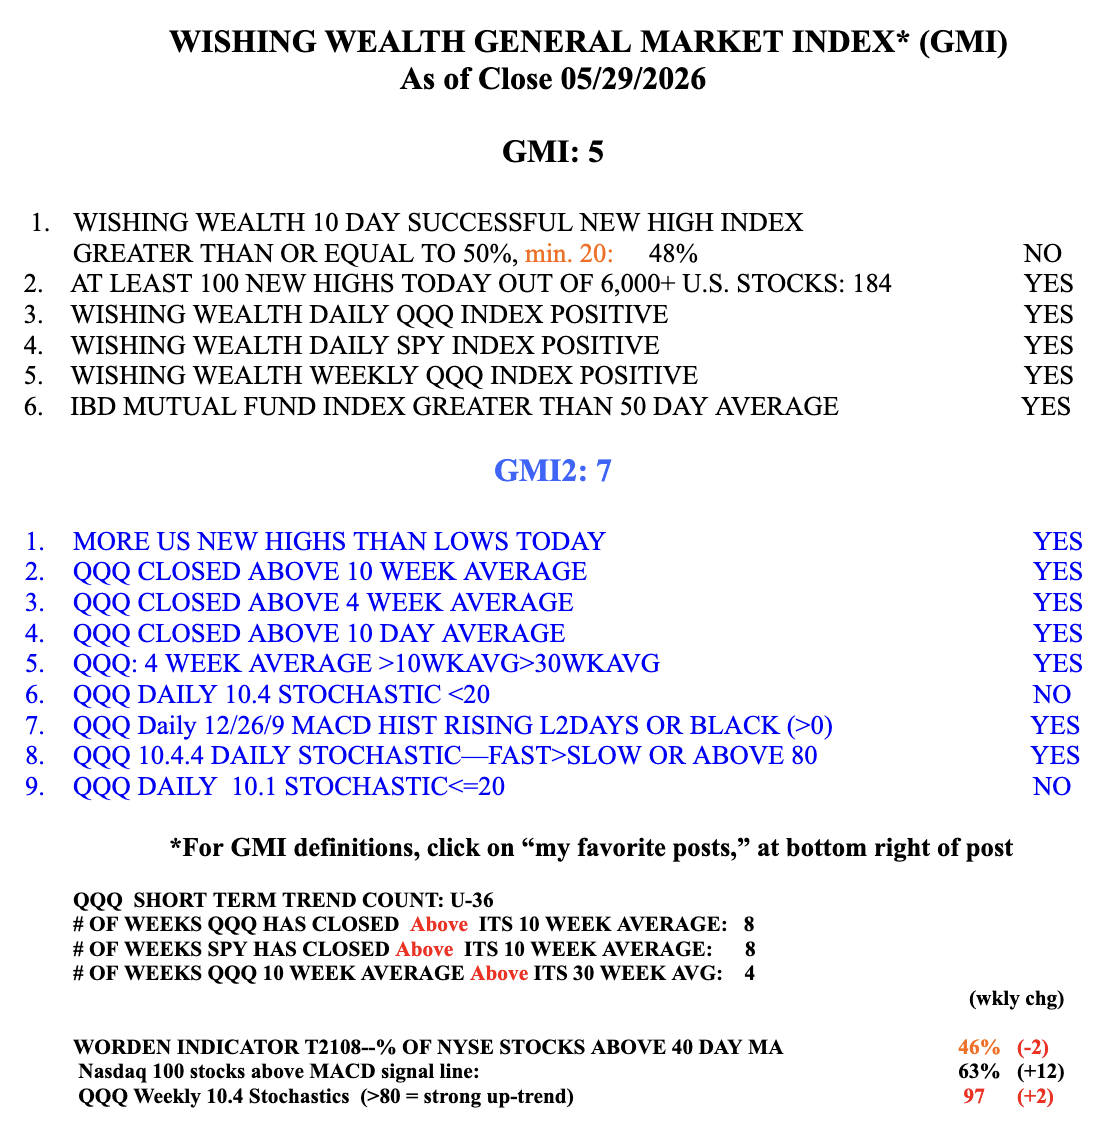
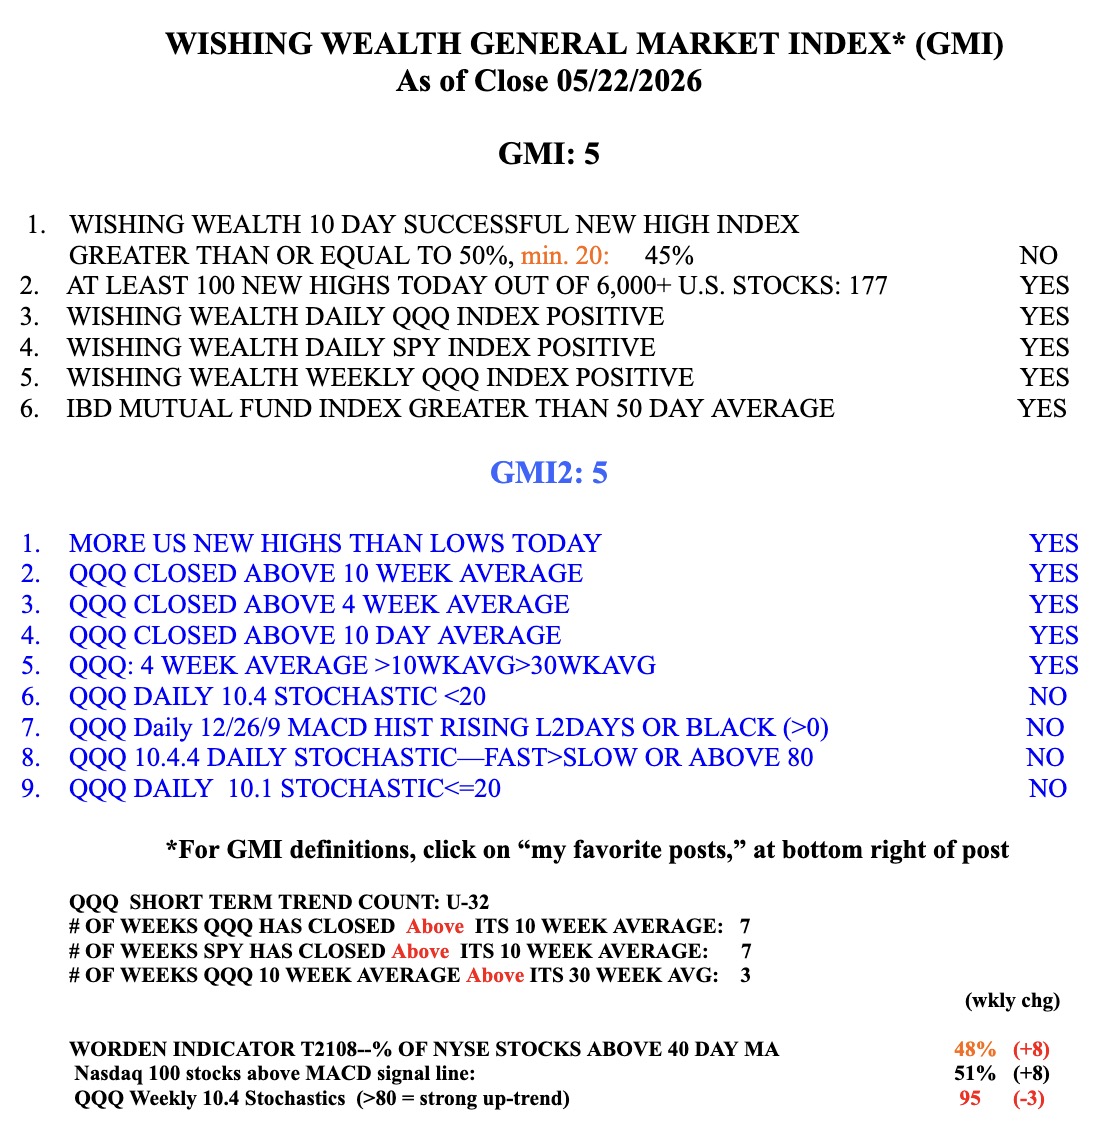
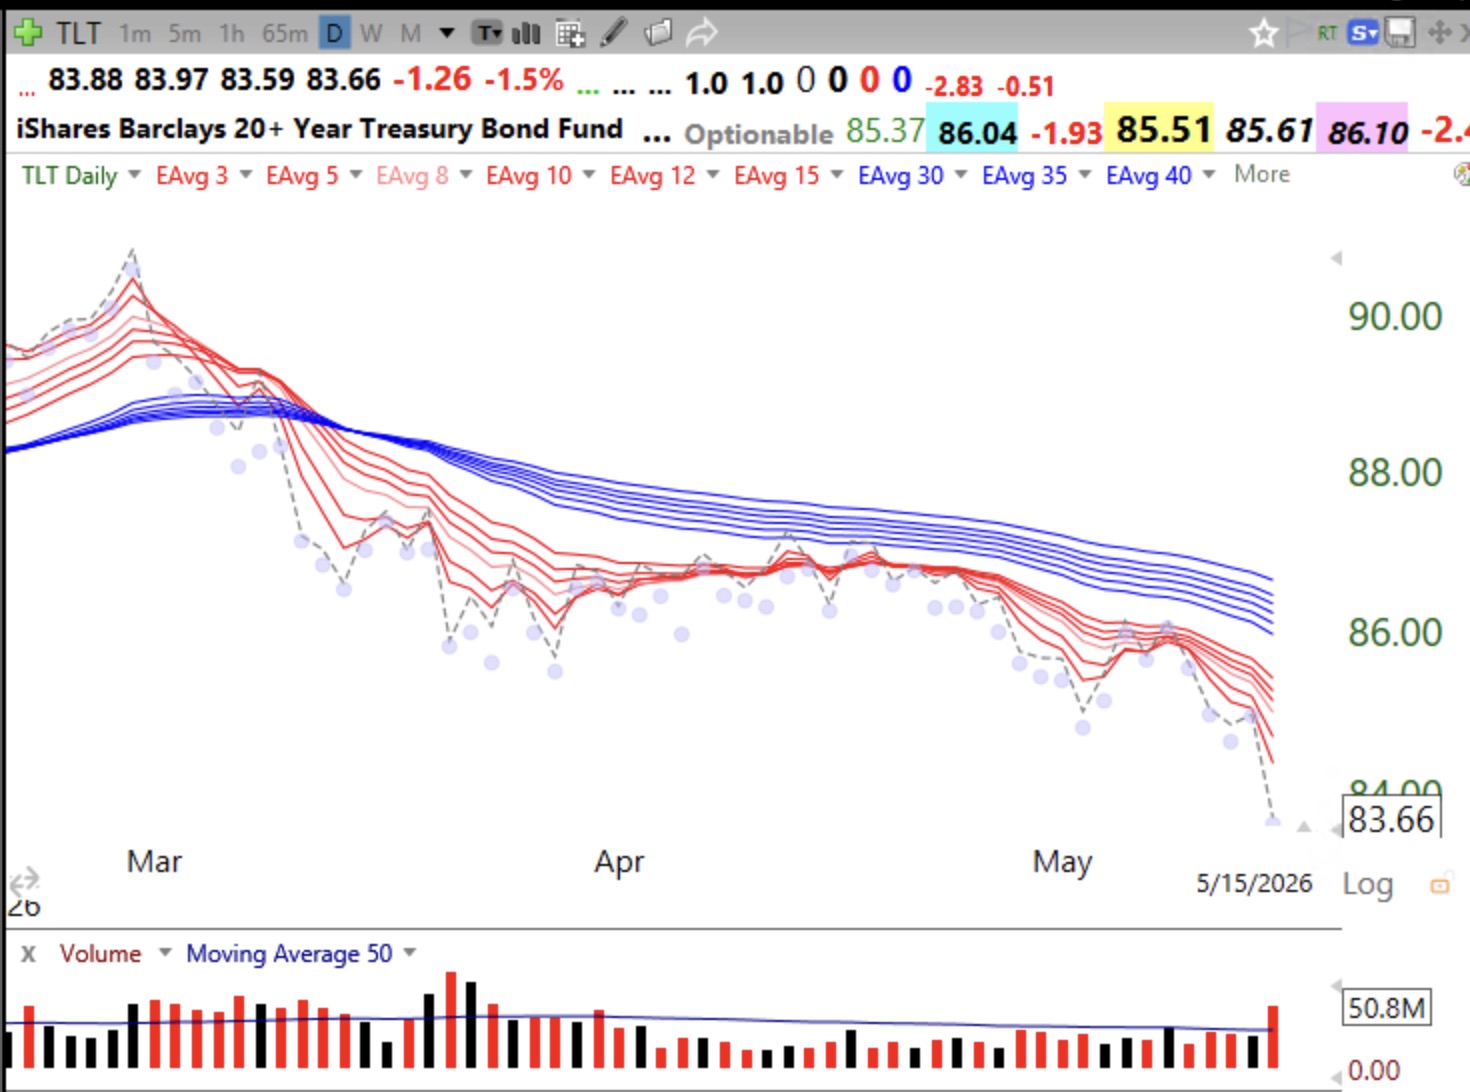
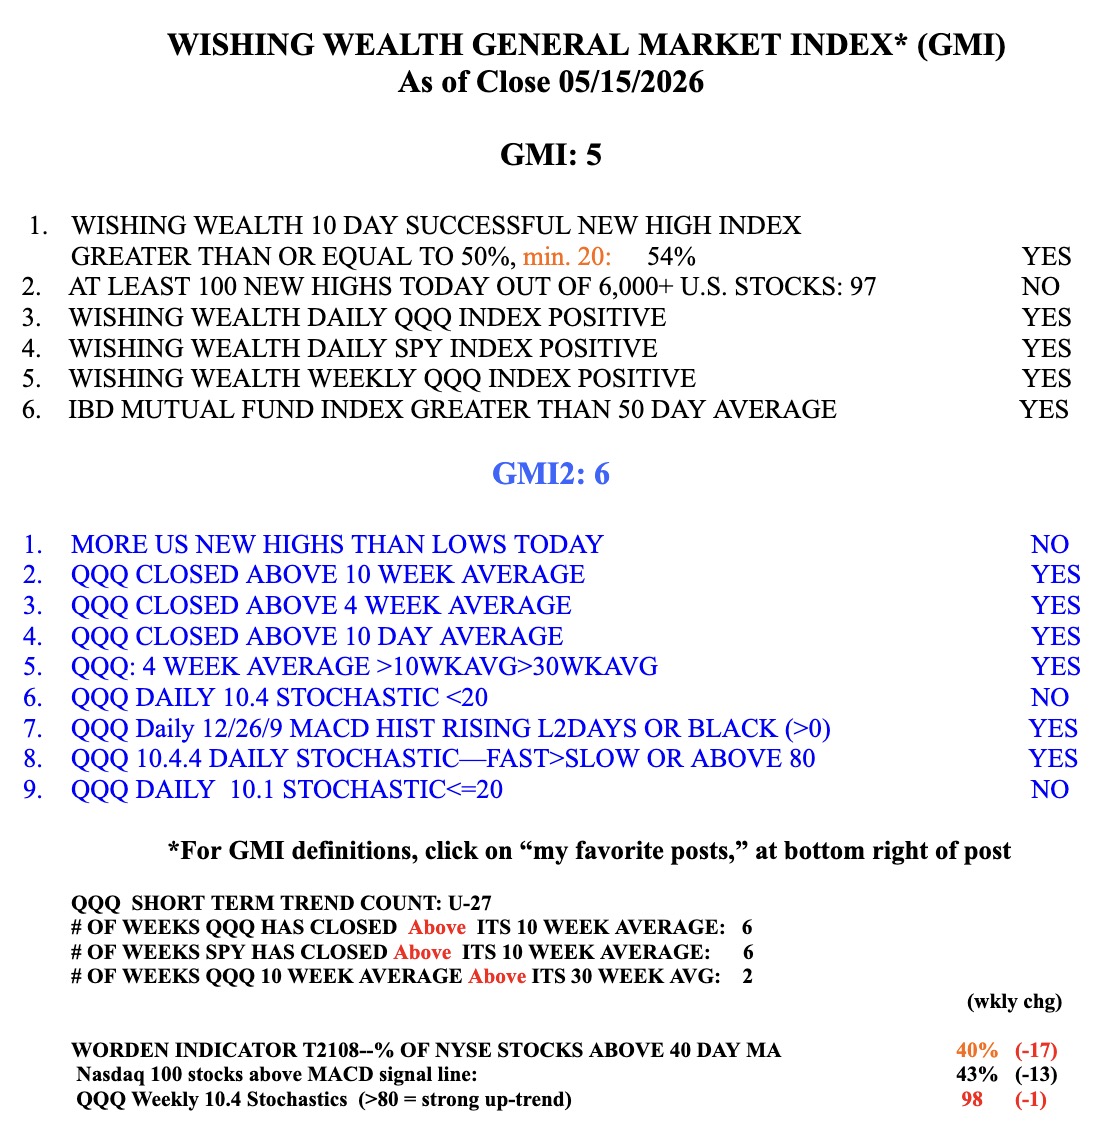
While the GMI=5 and GREEN, I am very worried about the market internals. There have been 3 days last week with 100 or more US stocks at new yearly lows, a huge departure from recent times. Theses 3 were the only such days since April 1! Before that the next day with 100 or more lows was March 20, with 153. I have found that when the market indexes are climbing to new highs and the new lows are also climbing, the rally is suspect. And now look at interest rates on the 20+ year US bonds. TLT is now in a BWR daily down trend and swooned on high volume last Friday. When bonds fall the interest rates rise. To understand this inverse relationship, think of it as being like a stock paying a dividend. When the price of the stock falls the yield which is a percentage of the price rises. For example, X pays $5 annually and is selling at $100, yield= 5/100 or 5%. If the price falls to $50, then the yield rises to = 5/50 or 10%. Most bonds pay a fixed dividend so that as their price declines the yield rises and visa versa. TLT dropped to 83.33 on Friday.
Screenshot
On Wednesday, NVDA reports earnings.There will be a lot of volatility. I will reduce risk on everything by Tuesday’s close. I need to protect my recent gains.
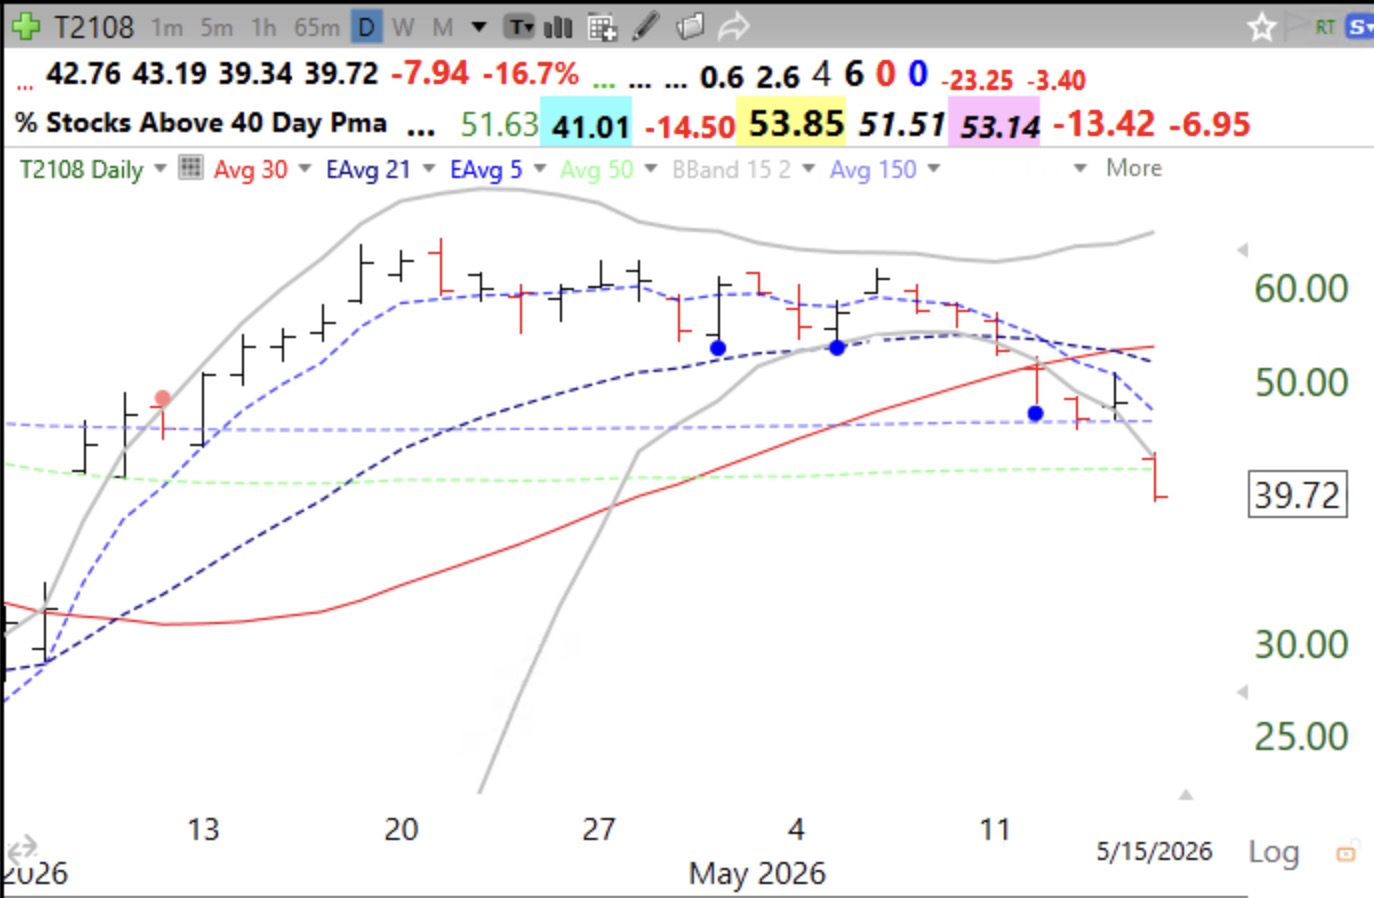
The GMI table shows that T2108 has declined to 39.72. That means that only 40% of NYSE stocks closed Friday above their 40 day averages, a major sign of general weakness.