Z had a GLB to an ATH (all-time high) on Thursday on above average volume. Note earnings released yesterday.
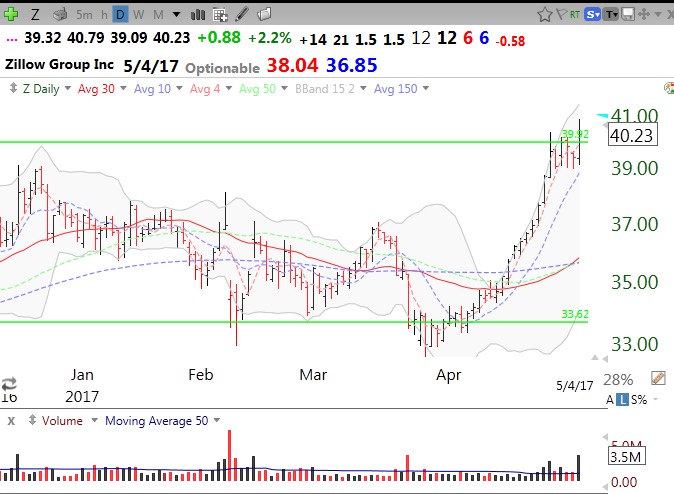
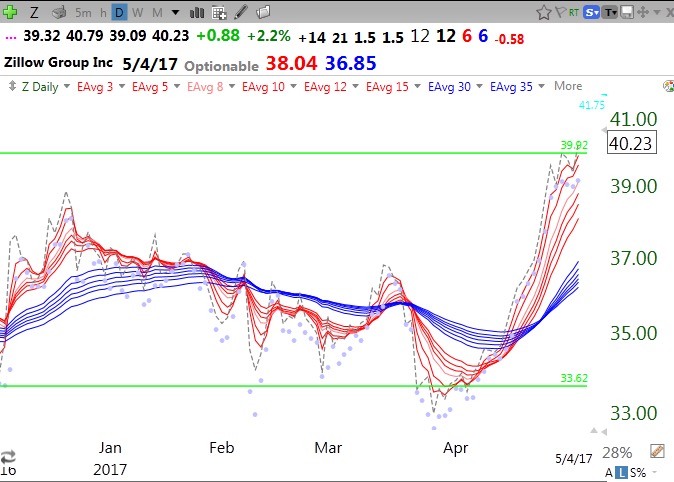
Z has a perfect RWB pattern (12/12/6/6). Here is the daily RWB chart.
Stock Market Technical Indicators & Analysis
Z had a GLB to an ATH (all-time high) on Thursday on above average volume. Note earnings released yesterday.
Z has a perfect RWB pattern (12/12/6/6). Here is the daily RWB chart.
Watching for break-out above pivot (239.53) on above average volume.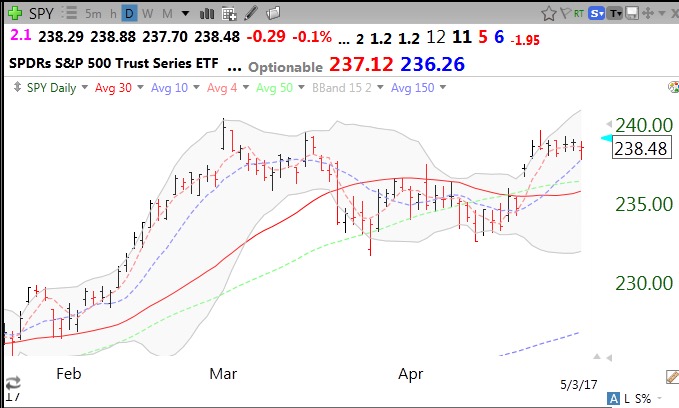
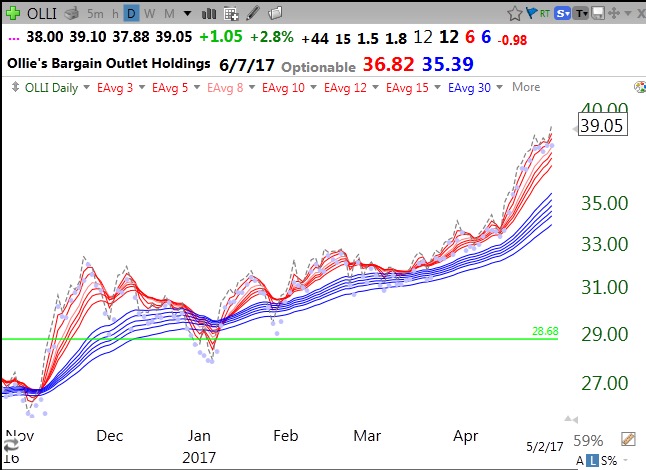
OLLI had a GLB to an ATH in November and retested the green line twice before beginning a sustained rise. Its daily RWB chart is perfect with all daily (and weekly) moving averages lined up, 12/12/6/6. OLLI reports on June 7. See my glossary for definitions.