GMI: +6; Short term weakening; Failed break-outs: CMTL

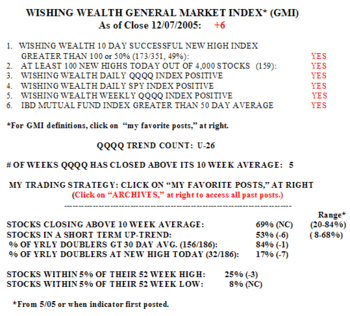
Things remain fine with the GMI still at the maximum value of +6.  Gmi1207 However, for the second time since this rally began the SPY and the DIA each closed below their 10 day averages, a sign of short term weakness in these indexes. The QQQQ is stronger and remains above its 10 day average.  These three ETF’s remain far above their 30 and 50 day averages, so the up-trend remains intact.  Between 27-33% of the Nasdaq 100, S&P 500 and Dow 30 stocks rose on Wednesday.  Note also that only 49% of the 351 stocks that hit a new high 10 days ago closed higher on Wednesday than they closed ten days earlier.  This is a sign of failed break-outs (see CMTL below). The percentage of stocks in my universe of 4,000 that remain in a short term up-trend continues to recede and is now at 53%, down from 65% last week.  However, 84% of the stocks that have doubled in the past year remain above their 30 day averages and 69% of all stocks are above their 10 week averages.  These latter stats indicate that in the face of the short term weakening, the longer term up-trends remain in place, especially for the leading stocks.  Wednesday was the 25th day of this QQQQ up-trend (U-25)………….
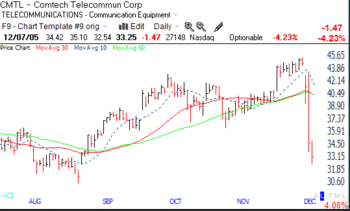
It is still a good idea to make sure all sell stops are in place to protect against sudden drops. Cmtl  Some breakouts are failing miserably.  For example, I was stopped out of CMTL on Monday and it collapsed on Tuesday.  When stocks that look like they are breaking out suddenly reverse like this one did, it can be a sign of some impending weakness in the general market. If I had bought a lot of shares in my initial purchase of CMTL or failed to immediately place a protective stop loss, I could have been hit with a significant loss.  I always place a protective sell stop immediately after I make a purchase.  If I get sold out and whipsawed, I can just buy the shares back.  Stocks that fake me out with a sudden decline and then rebound often go considerably higher. I have learned that I should ignore my negative emotions from the prior loss and just buy it back (and put in another protective sell stop).  If I am faked out of the stock, so were other traders.  After we all sell, and give others the chance to buy our stock at reduced prices, the rise can begin. 
NOTE:    A NEW SECTION TO THE BOTTOM RIGHT PROVIDES LINKS TO MY FAVORITE PRIOR POSTS.  THESE INCLUDE MY STRATEGY POSTS, DEFINITIONS OF THE GMI COMPONENTS, AND MY ANALYSIS OF WHY THE TRADING TECHNIQUES OF THE GREAT NICOLAS DARVAS WORK BEST DURING BULL MARKETS AT ALL-TIME HIGHS.

How have you used this site to inform your trading?  Can you send me some experiences I can post for others  (anonymously, with your prior permission)?  Please send your pearls of Wishdom to me at: silentknight@wishingwealthblog.com

GMI: +6: Minor weakening occurring; JNJ post

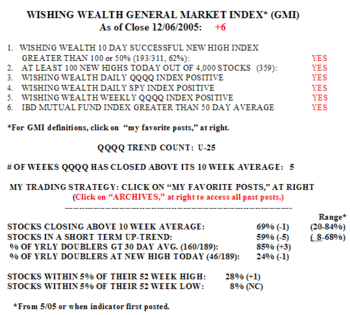
The GMI is still at +6.  However, some of my other indicators are down from their recent peaks reached last Friday, including the percentage of stocks in a short term up-trend (59%, down from 65%) and those above their 10 week averages (69%, down from 73%).  Gmi1206 There were 359 new highs on Tuesday, the highest since July 20.  The fact that the market closed off the highs of the day is troubling, but not enough to change the current outlook.  Tuesday was the 25th day of the current up-trend.  Between 53%-63% of the Nasdaq 100, S&P 500 and Dow 30 stocks advanced on Tuesday.  Check out my discussion of JNJ as a sick stock posted on Saturday if you missed it. It’s all in the chart!

NOTE:    A NEW SECTION TO THE BOTTOM RIGHT PROVIDES LINKS TO MY FAVORITE PRIOR POSTS.  THESE INCLUDE MY STRATEGY POSTS, DEFINITIONS OF THE GMI COMPONENTS, AND MY ANALYSIS OF WHY THE TRADING TECHNIQUES OF THE GREAT NICOLAS DARVAS WORK BEST DURING BULL MARKETS AT ALL-TIME HIGHS.

How have you used this site to inform your trading?  Can you send me some experiences I can post for others  (anonymously, with your prior permission)?  Please send your pearls of Wishdom to me at: silentknight@wishingwealthblog.com

GMI: +6; New up-trend count added

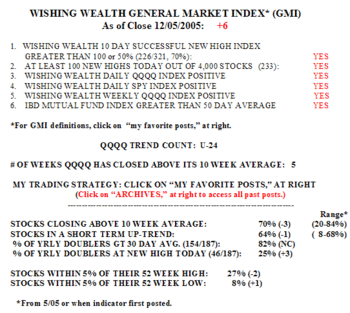
The GMI is steady at +6.  On Monday there were 226 successful 10 day highs and 233 new 52 week highs.  Gmi1205 Only 27% of the Nasdaq 100 stocks rose, along with 31% of the S&P 500 stocks and 33% of the Dow 30 stocks. As this table shows, there was a little weakness in my indicators, but no reason to question the up-trend.  Monday was the 24th day of the QQQQ up-trend (U-24).

A great indicator of a strong market is when the QQQQ’s weekly closes remain above its 10 week moving average.  In Saturday’s post I noted how long some of the recent rallies have lasted.  I therefore decided to add to the GMI table today a count of the number of weeks that the QQQQ has closed above its 10 week average.  The current count is:  5…………………..

NOTE:    A NEW SECTION TO THE BOTTOM RIGHT PROVIDES LINKS TO MY FAVORITE PRIOR POSTS.  THESE INCLUDE MY STRATEGY POSTS, DEFINITIONS OF THE GMI COMPONENTS, AND MY ANALYSIS OF WHY THE TRADING TECHNIQUES OF THE GREAT NICOLAS DARVAS WORK BEST DURING BULL MARKETS AT ALL-TIME HIGHS.

How have you used this site to inform your trading?  Can you send me some experiences I can post for others  (anonymously, with your prior permission)?  Please send your pearls of Wishdom to me at: silentknight@wishingwealthblog.com