I have been alerting you for sometime to the weakness I have been seeing in stocks. I refused to ride out the market declines in 2000, 2008 and 2022. I tell my young students that they can afford to stay invested in SPY when the market declines because the market, but not all individual stocks, will likely come back in their lifetimes. As for me, being near retirement, I would rather keep my $$$$ safe and would be grateful to just have these accounts earn back my annual RMDs, about 5% now. I think there are too many people who, based on their recent market experiences, think that the market will always rebound soon. I can only tell you that when the market enters a Stage 4 decline it often is at the beginning of a major fall. IWM, for example, looks particularly weak now, as this weekly chart shows. When the 30 week average curves down, I go into cash and wait for it to curve up again. I tell my students that if they are crossing a street and see a truck bearing down upon them at high speed, they should not argue with the truck driver or opine that the driver always stops at a particular place. I tell them to get the hell out of the way! That is what I do when my indicators suggest to me that the market is swooning. I can always reinvest my money when the a new up-trend is evident.
Look at this 10:30 weekly chart of IWM, the Russell 2000 index of small cap stocks. The 30 week average is beginning to curve down just as it did in 2022. Look what happened after the arrow I drew in 2022. Note that the 10 week average (dotted line) has now crossed below the 30 week average (red line) and the weekly close (gray line) is leading everything down. Are we at the beginning of a Stage 4 decline again? I am willing to wait on the sidelines. The other major index averages, DIA, SPY, QQQ have similar, but not as weak patterns. Go here to see Richard Moglen’s recent interview of Stan Weinstein about his invaluable discovery, Stage analysis. Richard was introduced to Stan’s book in my class and has created an online Masterclass with Stan. Mark Minervini had Stan speak at his recent birthday Gala. Richard and I are exploring offering my class as a TraderLion Masterclass, stay tuned for details.

And T2108, at 24%, is above the extreme levels where a bottom is likely. I started this blog to share with others what I am doing in the market after I saw so much carnage for my friends’ and colleagues’ accounts after the decline that began in 2000, while I was in cash. Everyone must determine their appetite for risk and how to protect their hard earned $$$$. I have very small positions in SQQQ and TWM which are leveraged inverse ETFs that rise when their underlying indexes (QQQ and IWM) decline. By the way, the $$$ contributed to my retirement accounts by the university each month continue to be invested in large mutual funds, a form of dollar cost averaging. I just transferred the total accumulations weeks ago out of mutual funds. In the 2000 decline I sold my growth mutual funds at over $100 per share and watched them decline to the 30s. Think of the stress I avoided. I might have panicked and sold at the bottom! I reinvested when the 30 week average of QQQ curved up, and my account grew about 50% that year. However, there are no guarantees that I am correct now. I am just a trading chicken.
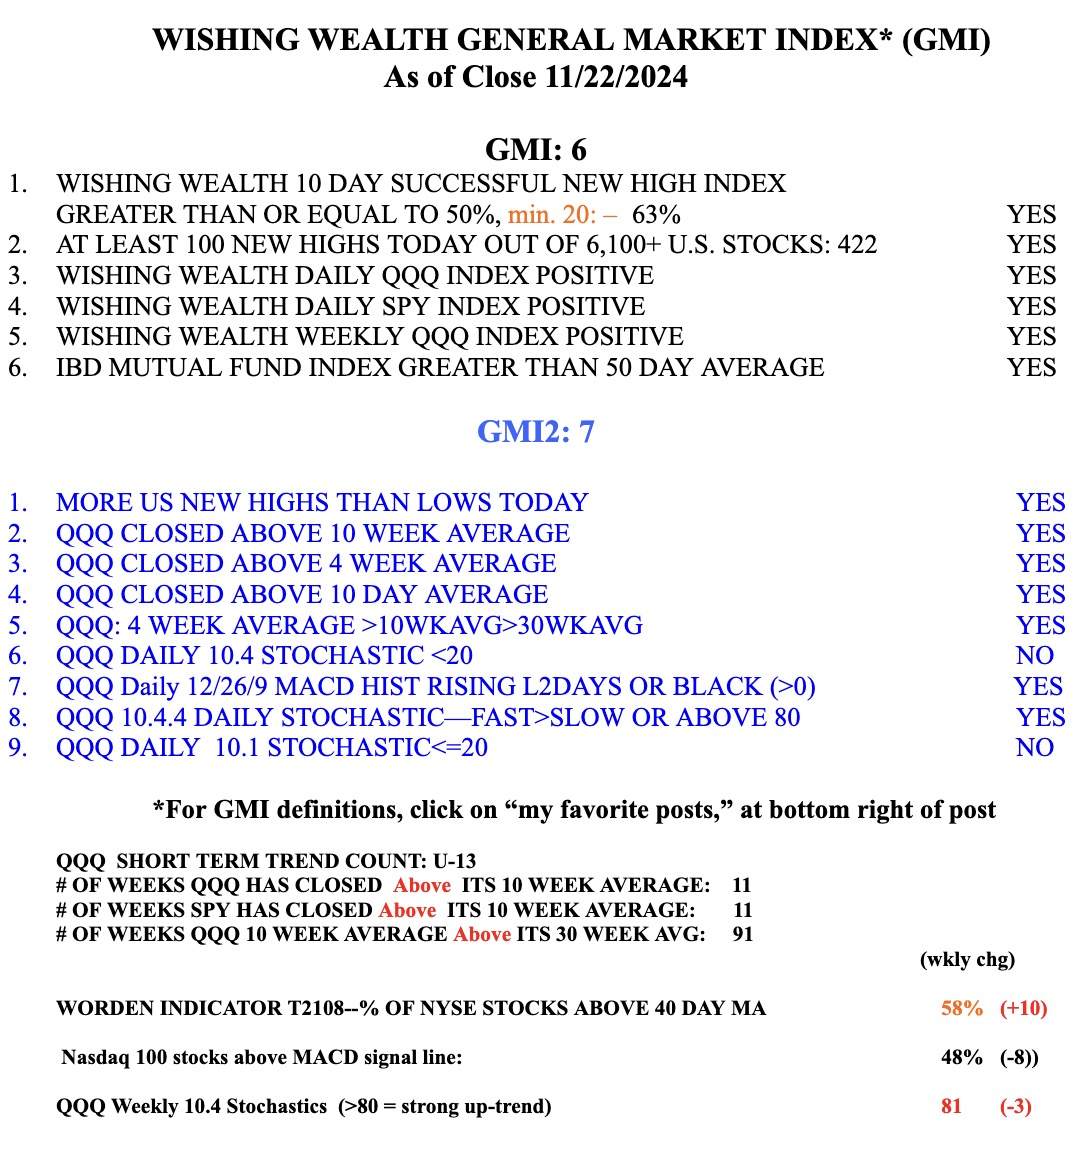
The fact that the GMI has been Red since February 24, is another reason for me to be defensive. It is so much easier for me to make money trading long in stocks when the GMI is 5 or 6 and Green. Best of luck, my readers.