This week is critical for telling us whether QQQ will hold. It remains in a Stage 2 up-trend, above its rising 30 week average. But it may retest its last green line break-out at 637.01. A weekly close below that level would be a major sign of weakness.
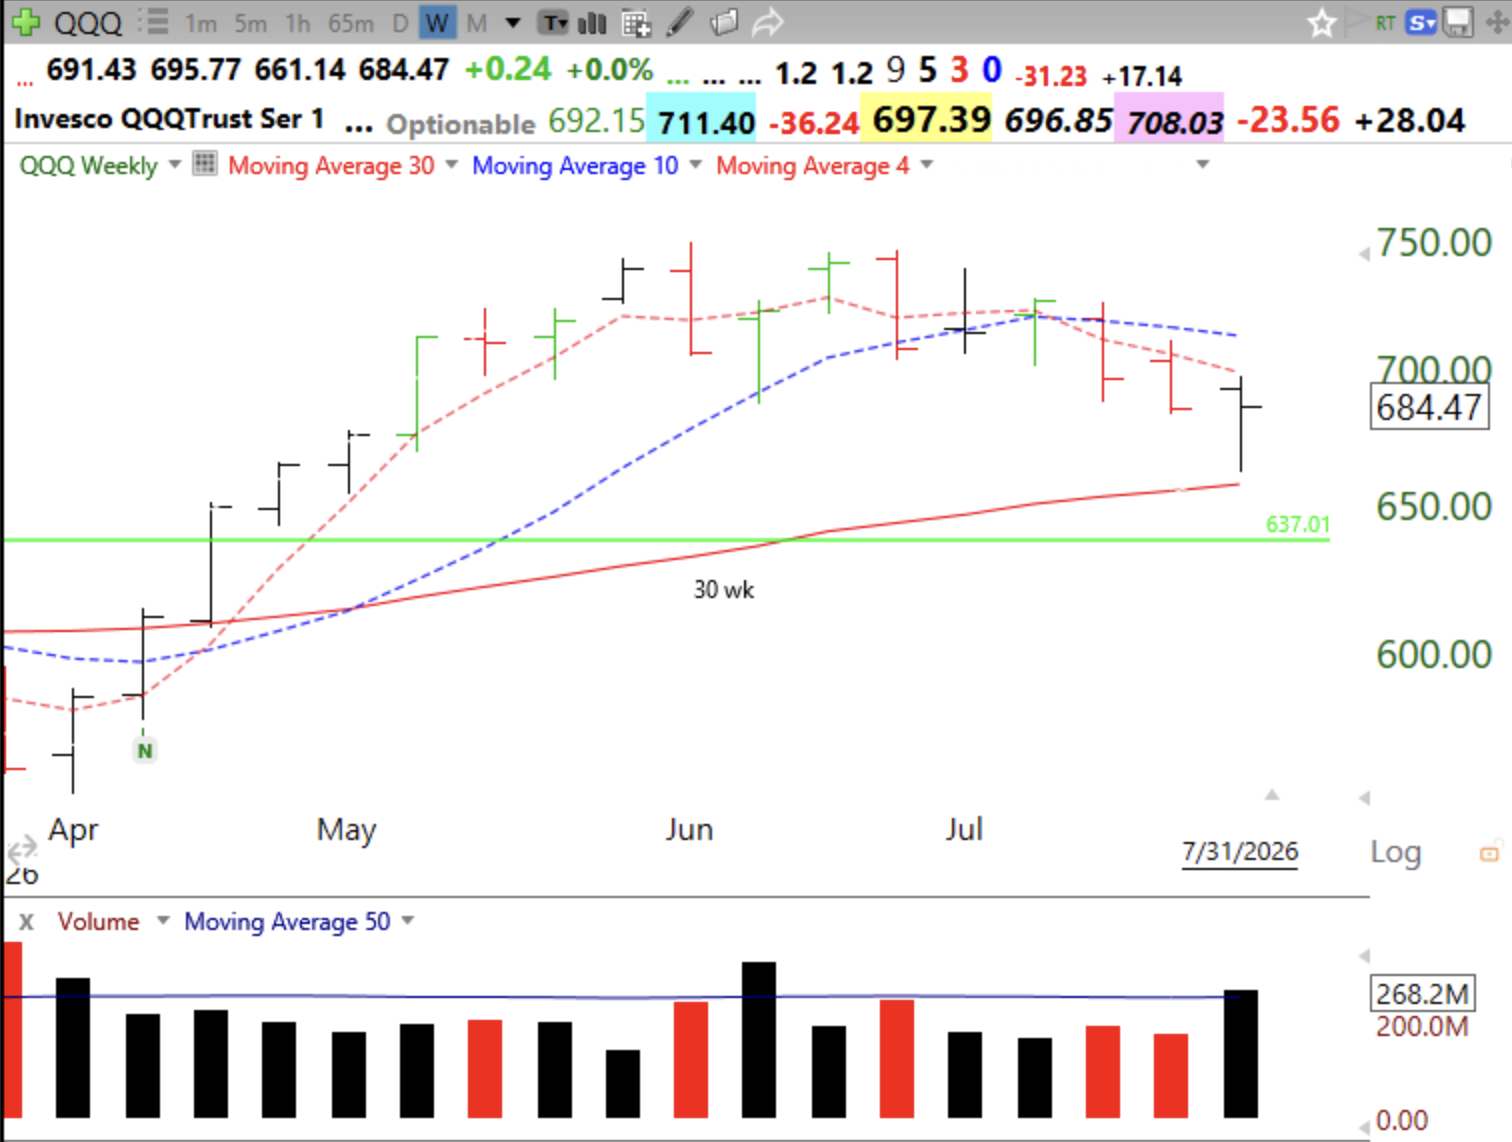
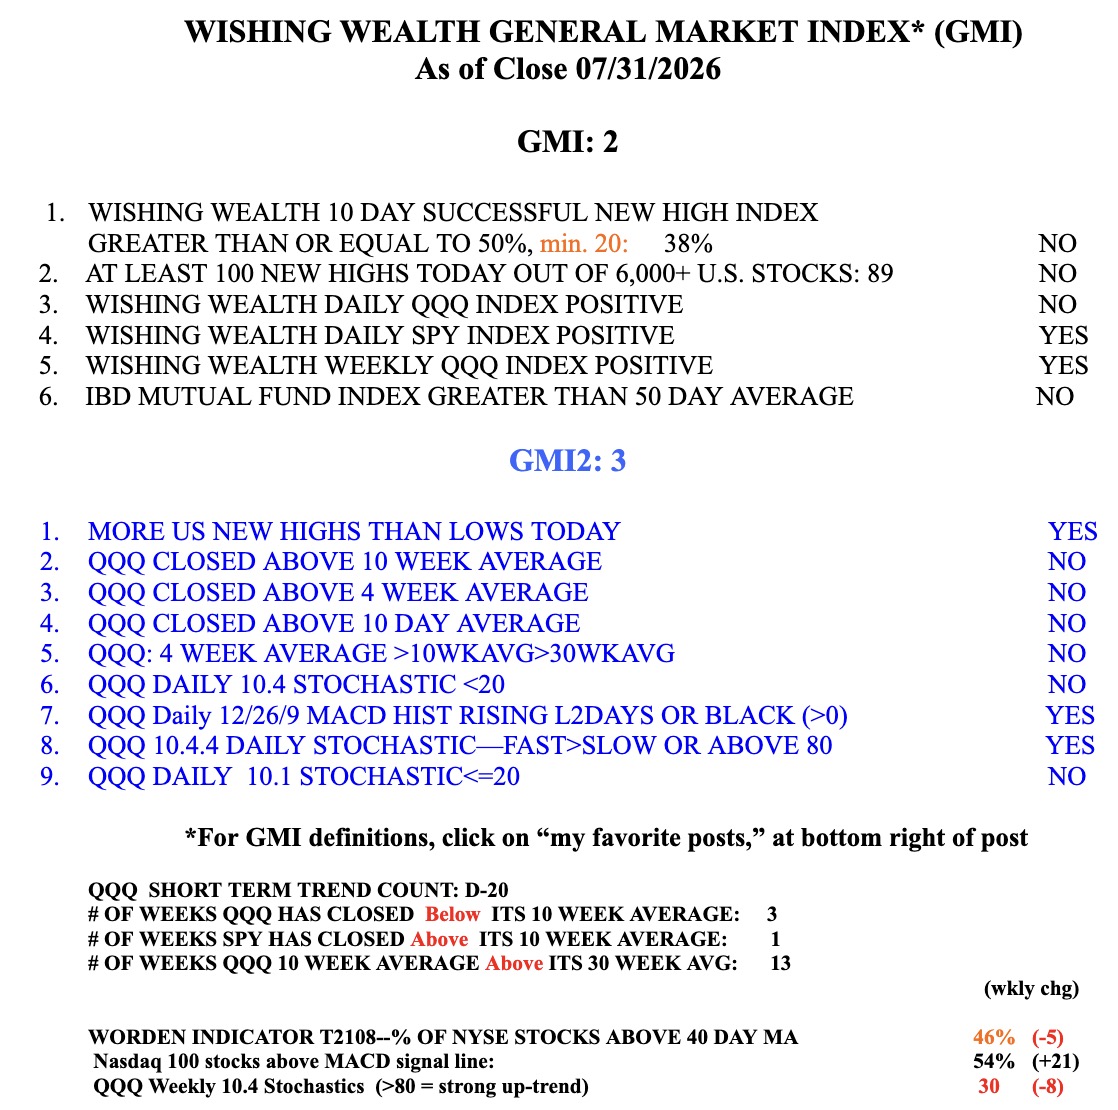
A GMI of 2 is too weak for me to trade growth stocks now. The weekly 10.4 stochastic is now down to 30. A value above 80 is a sign of a strong up-trend. The post-earnings period could be very bad. Cash is king right now.
Thanks for all the data, do you have some way of picking up your setups on TC2000, I built the GLB, at least I think I did. I still run the old stockfinder. It’s not a bad exercise for me, to do, but I was thinking of doing the rocket stocks. I know your busy, but thought I would ask.