I am 100% in cash in my trading IRA account, having reduced holdings the past 2 weeks. I like to do most of my trading in my IRA because there are no tax issues. I can go in and out at will. I remain 100% invested in mutual funds in my pension accounts, where trading is limited.
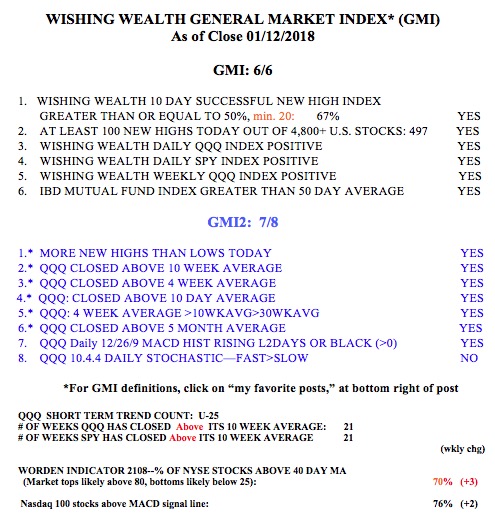
This is not the time to panic. It is true that bloody Fridays often lead to bloody Mondays when many people decide to exit after pondering their falling balances over the weekend. These people will likely sell to the eager professionals at lower prices. The market indexes I follow have not become oversold. The put/call ratio =.97, showing that option players are not scared enough yet. When the ratio reaches 1.2 or higher we will be near a bounce. Similarly, the daily 10.4 stochastics indicator I watch for the QQQ is at .47. The market indexes usually bounce around .20 or less. So I expect more of a decline, at least early in the day on Monday.
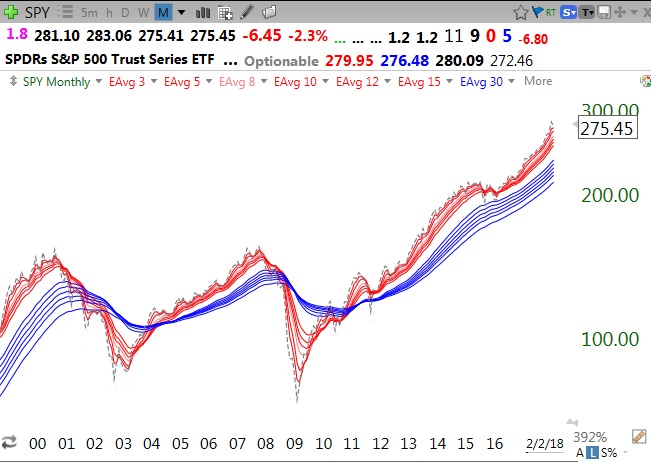
The chart below is a RWB monthly chart of the SPY. I want to show what the bull market tops looked like in 2000 and 2007. Note that a major decline begins with the index (indicated by the gray dotted line) closing below all of the red line shorter averages. Then the red lines turn down and converge with the blue lines.This pattern takes several months to develop. The RWB pattern (red above blue with white space between them) then dissolves and the red lines move below the blue lines (for ming the opposite BWR pattern). A quick glance at the current market shows that the RWB pattern is intact and the index (dotted line) remains above all of the rising red lines.
Alternatively, this weekly chart of the SPY shows it to be in a Weinstein Stage II up-trend. It is rising above the rising 30 week average (red line).
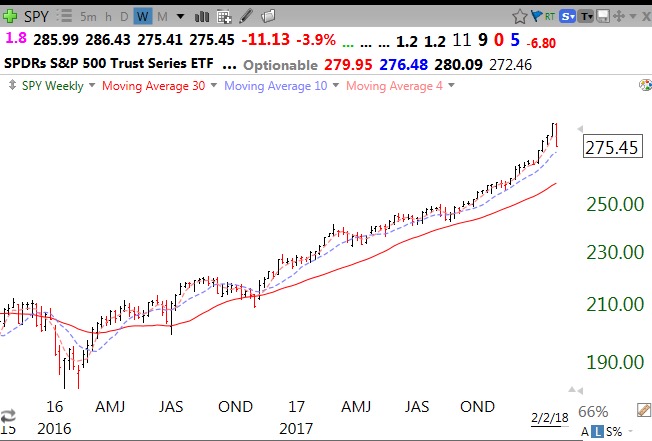
I tend to exit the market in my pension accounts when the index closes below its 30 week average and the average begins to turn down. Such a decline last happened in 2016. The 30 week average for the SPY is now at 258.20. Let’s see if the SPY finds support at its 10 week average (blue dotted line), currently at 272.46. The SPY and QQQ have closed above their 10 week averages for 24 straight weeks (see table below). My long term pension money remains fully invested, for now, while my trading account is in cash.
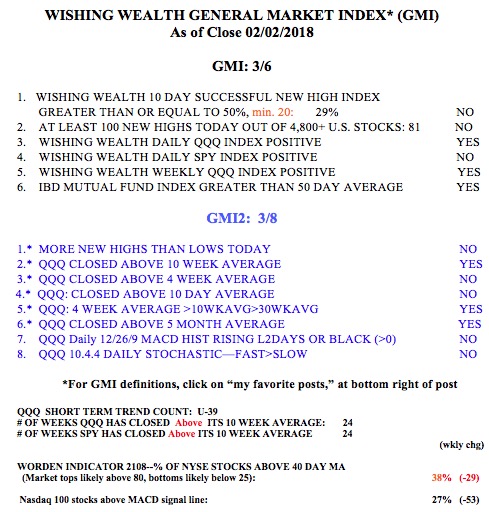
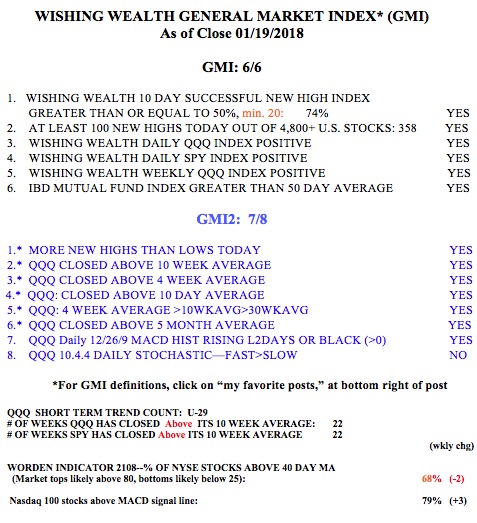
The GMI and GMI2 have both weakened considerably. Two consecutive days with the GMI less than 3 turns its signal to Red. IBD now sees the “uptrend under pressure.”