The book that changed my trading life was the one listed to the lower right by Nicolas Darvas, How I made $2,000,000….. That book, which I discovered in the 1960’s, taught me to abandon buying stocks that were cheap and trading at new lows and instead to focus on stocks at all-time highs. While this strategy seems counterintuitive, we all want bargains, it makes sense with stocks. We all want to buy a stock that goes to the moon. On its way to the moon it must be gaining altitude and repeatedly hitting new highs. In the appendix to his highly popular book, Darvas answered a question from a reader about whether a stock he bought needed to always be at an all-time high–his reply, no exceptions to this criterion. Another little known Darvas criterion was that a stock must have already doubled in the past year. As with human beings, the best predictor of future behavior is past behavior.
So for many years, I have looked for stocks hitting all-time highs. William O’Neil and David Ryan have both mentioned Darvas’ book as one of the few that influenced them. IBD often departs from the all-time high requirement, however. I depart from Darvas’ strategy too. Darvas bought rising stocks breaking out of trading ranges, or boxes, defined by daily prices. That approach did not work well for me because it led to a lot of whip-sawing of prices. After studying monthly charts in the 80’s, I noticed that many growth stocks hit a new high on a monthly chart, rested a few months, and then when they broke through their former historic peaks often went on to huge gains.
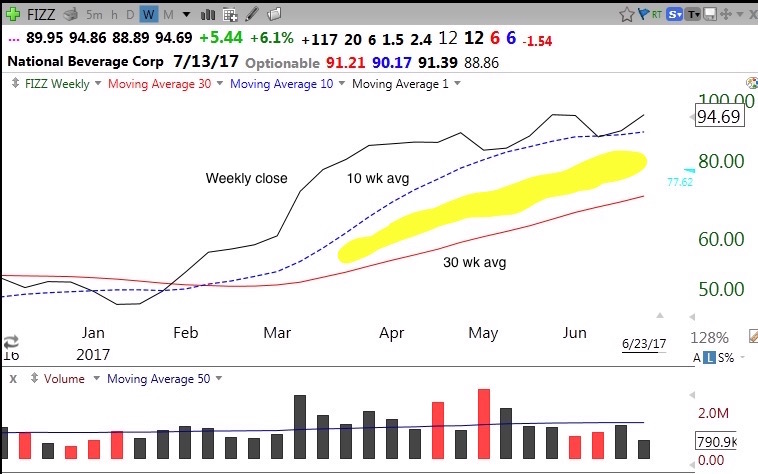
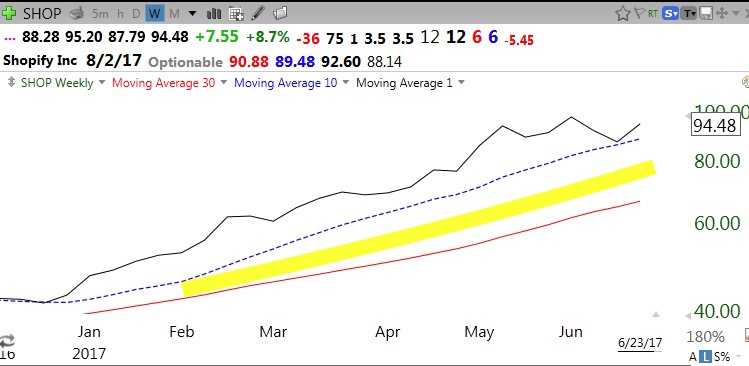
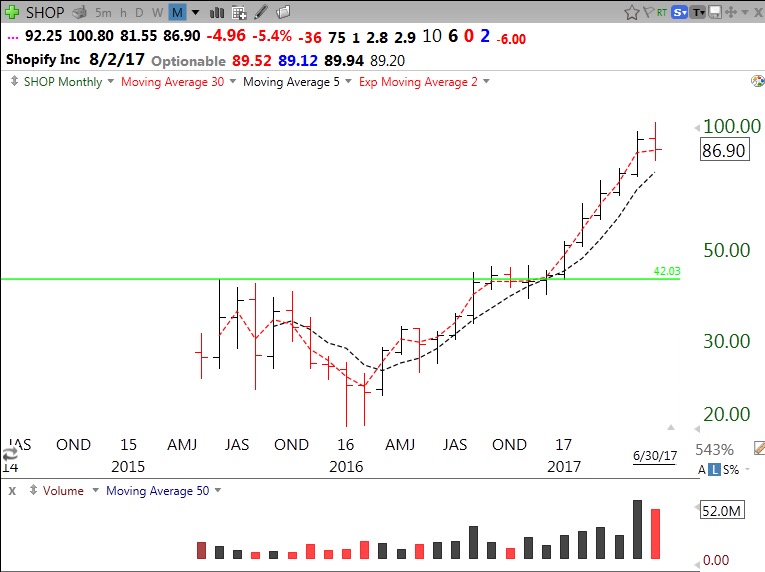
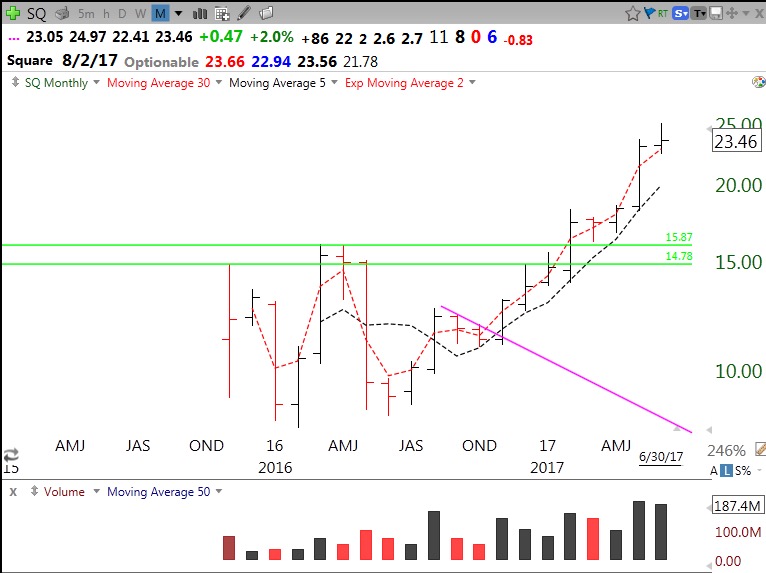
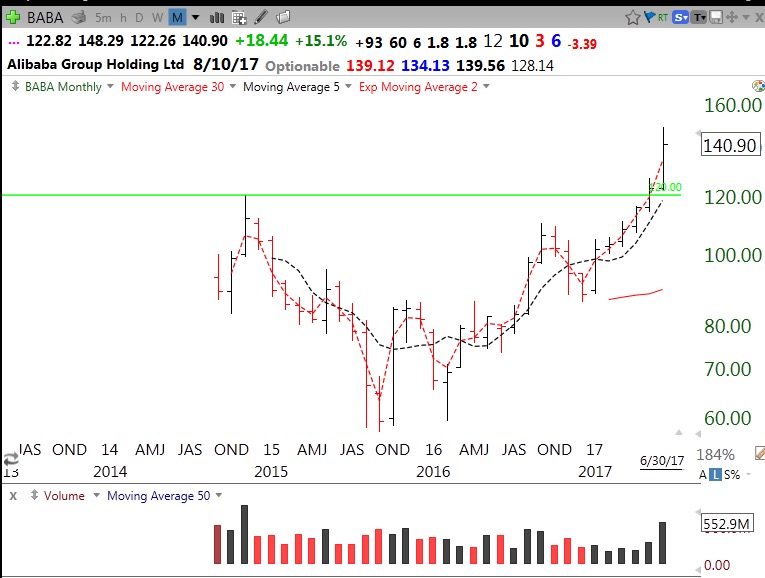
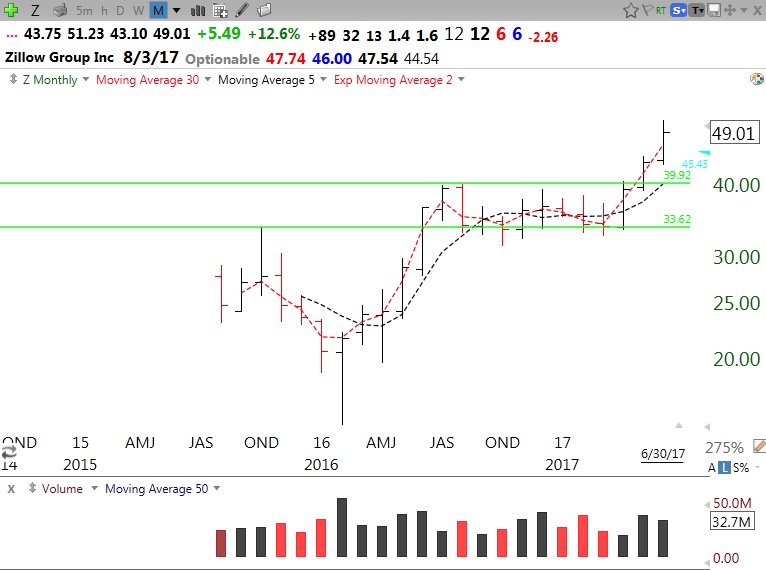
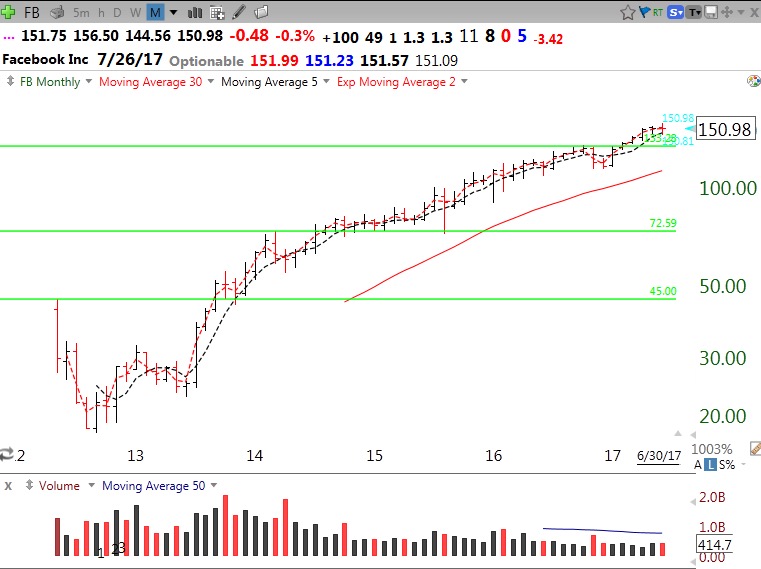
Hence I invented the concept of the green line break-out (GLB). On a monthly chart I draw a horizontal green line at the historic peak that month after the stock has failed to surpass it for at least 3 months (or 3 bars on a monthly bar chart). In other words, the stock has gone up to a new historic high and then rested/consolidated for 3 consecutive months. I maintain a watch list of stocks with green lines drawn in and program TC2000 to alert me immediately when a stock exceeds that line. I only buy a GLB if it occurs with above average trading volume and the stock must go on to close above the green line. If it closes back below the green line at anytime afterwards, I exit. If it retakes the green line I often buy it back. (I do not worry about wash sales in my tax deferred IRA). Stocks often retrace and retest the green line. Of course I consider other technical and fundamental characteristics to select which GLB stock I want to purchase. But that is what my students learn over a 14 week semester course. I cannot predict which GLBs will succeed. That is why it is critical to exit if the stock closes back below the green line.
Jesse Livermore wrote that if a recent IPO formed a base and then went on to an all-time high that was a screaming buy. I find that is often true if I can find a GLB for a stock that came public in the past few years, rested, and then broke out. Here are some monthly charts of some examples of GLBs.
It even worked for FB in 2013, which went on to several other GLBs.
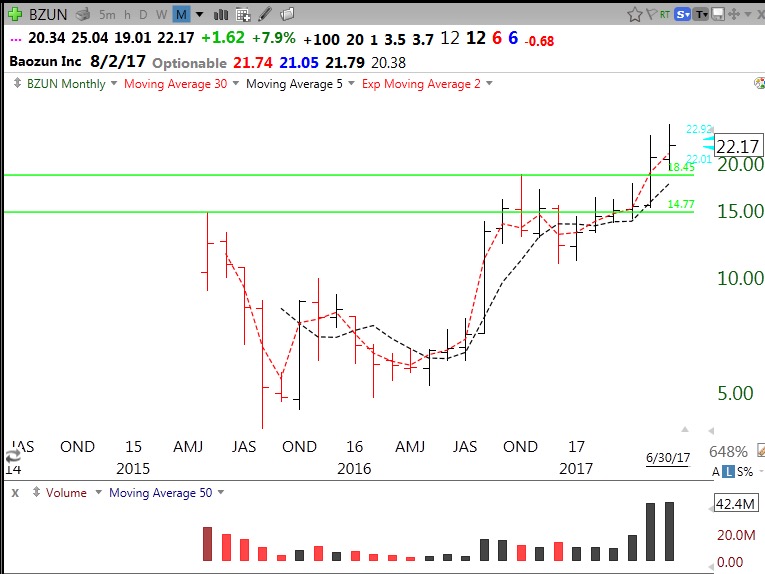
Will it work for BZUN?
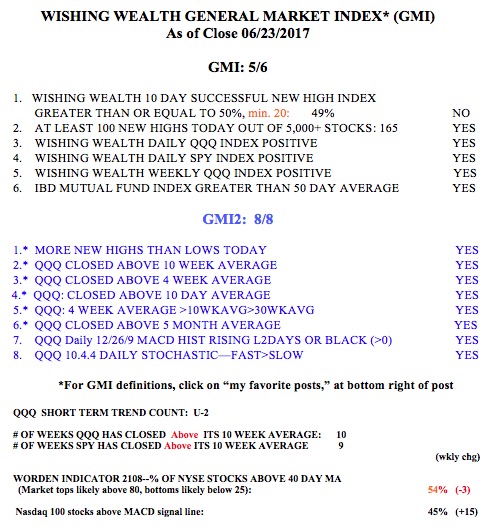
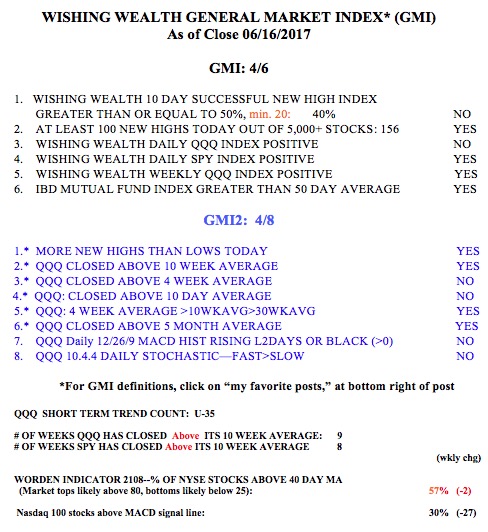
At the side of this blog post is a list of GLB stocks that have worked out. I do not know the percentage of GLBs that succeed, but they do better if the GMI (General Market Index) is on a Green signal. I often tweet out possible GLBs intraday, follow me at @WishingWealth
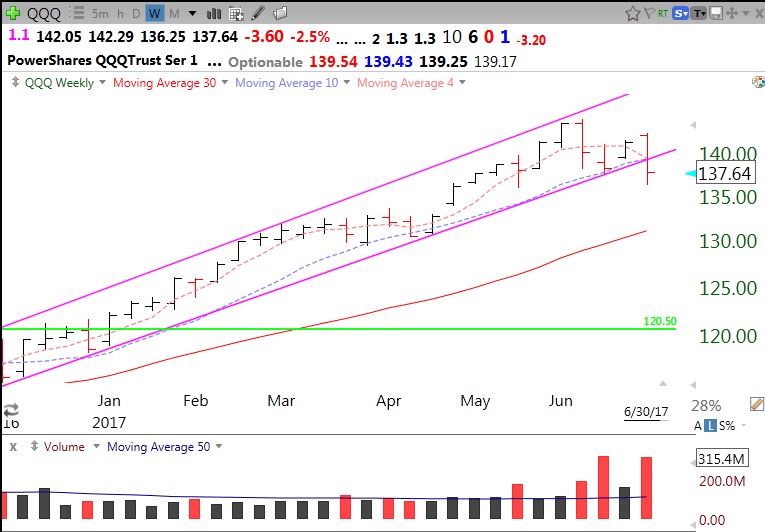
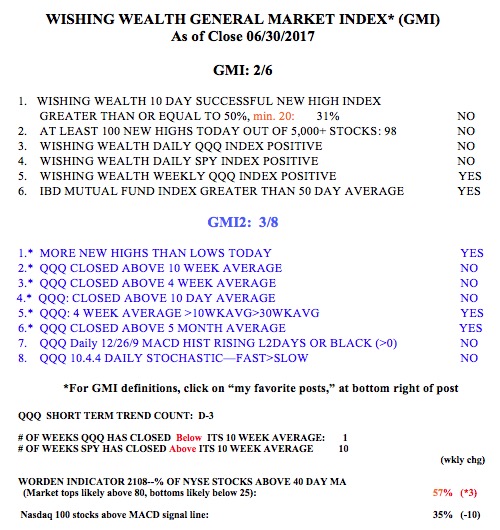
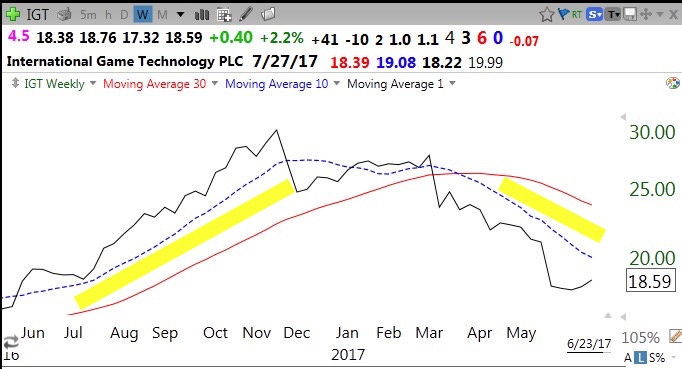
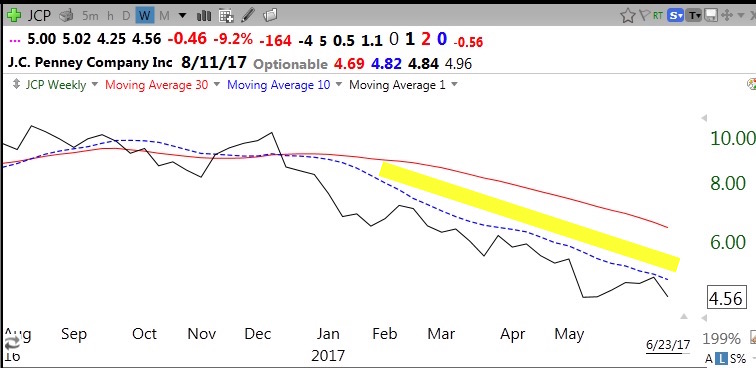
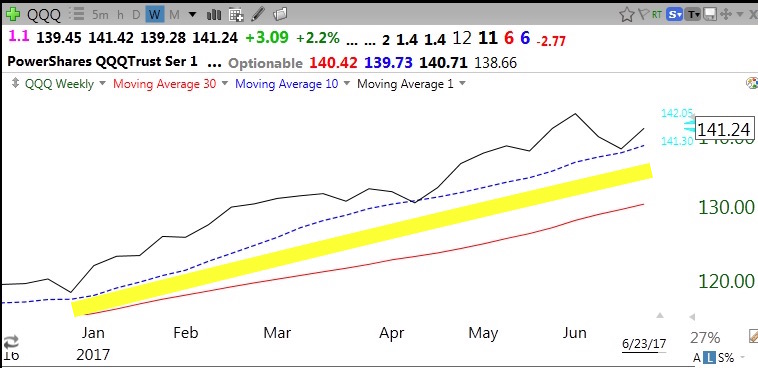
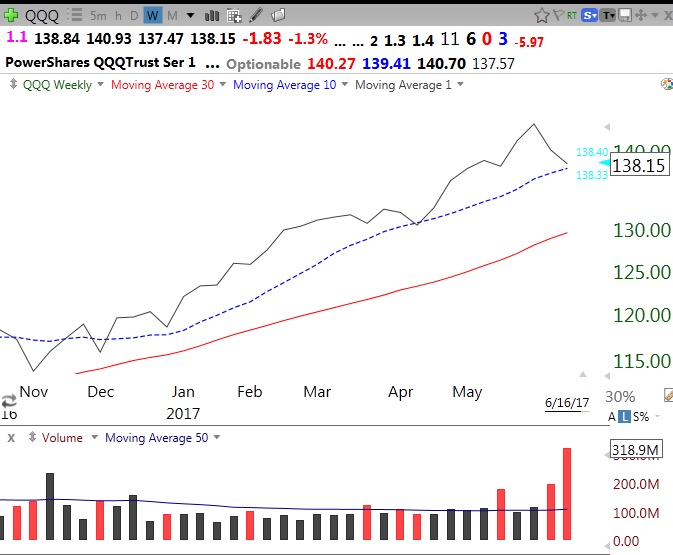
And the GMI is at 2 (of 6) and Green could flash Red with a weak day on Monday. The QQQ is now back below its 10 week average (blue dotted line), an ominous sign. And this break occurred on very high down volume.