Given my renewed interest in yellowband stocks, I created a simple scan that looks for stocks up at least 70% from their 50 week low, are within 20% of their 20 week high, are in a yellow band pattern and have regained their 10 week average last week. One of the interesting stocks to satisfy these criteria is UCTT. This weekly chart shows that UCTT rose on above average volume last week, is above its last green line top, and may be emerging from a cup and handle base. Note also from the statistics at the top of this chart that its most recent earnings were up +2850% with revenue up +76% and that the stock has already quadrupled over the past 12 months. Its next earnings are to be released on 10/25/2017.
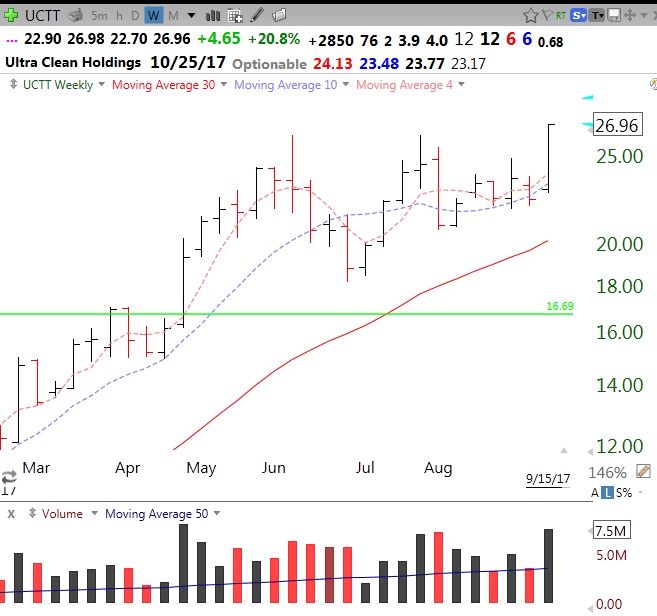
This weekly yellowband chart shows UCTT was in a multi-month yellowband pattern with the stock closing (solid line) above its 10 week average (dotted line), which was above its rising 30 week average (red line). The purple dots indicate the weekly lows and show that the lows each week tended to be above the 10 week average until the stock formed the recent base.
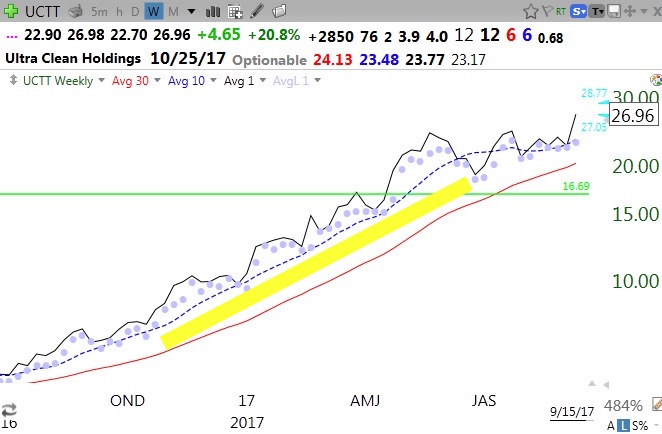
If I bought UCTT based on its yellowband pattern, I would consider selling or reducing my position if it closed any week (or day) back below its rising 10 week average. Other noteworthy stocks to come up in this scan were: NVDA, FSLR, LOXO, EXEL, HNH, NVMI and CORT.
You can run this scan yourself (09162017yellowband…..) in TC2000 by joining my club and also get some of my other scans. Just go to www.wishingwealthblog.com/club. The glossary on this blog describes the logic of most of the scans. And follow me on twitter @wishingwealth for intraday alerts–all of this information is for educational purposes only, no guarantees of any kind! Remember, most successful traders are only right on about 50% of their trades.
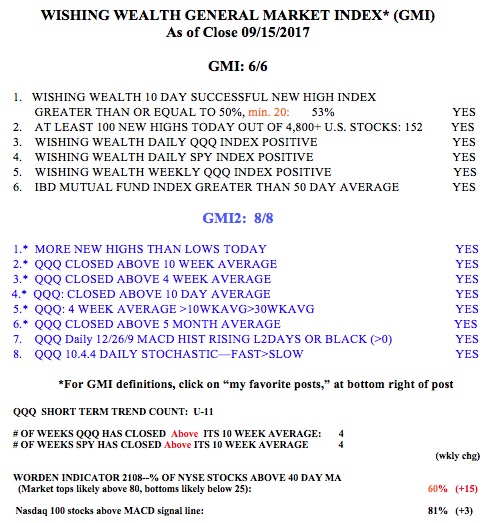
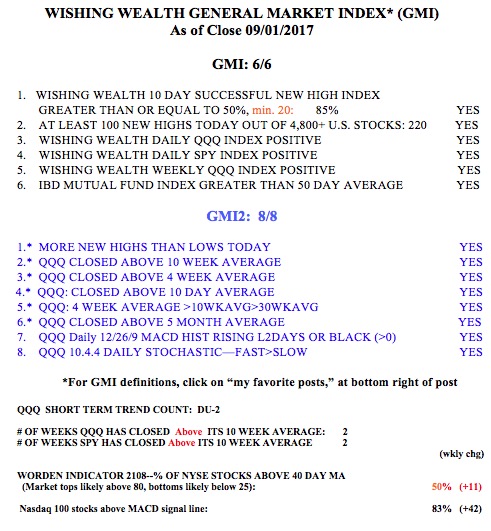
The GMI is at 6 (of 6) and the GMI-2 is 8 (of 8). I am watching inflation indicators closely to see if the Fed may tighten sooner than everyone expects. That will kill this bull…