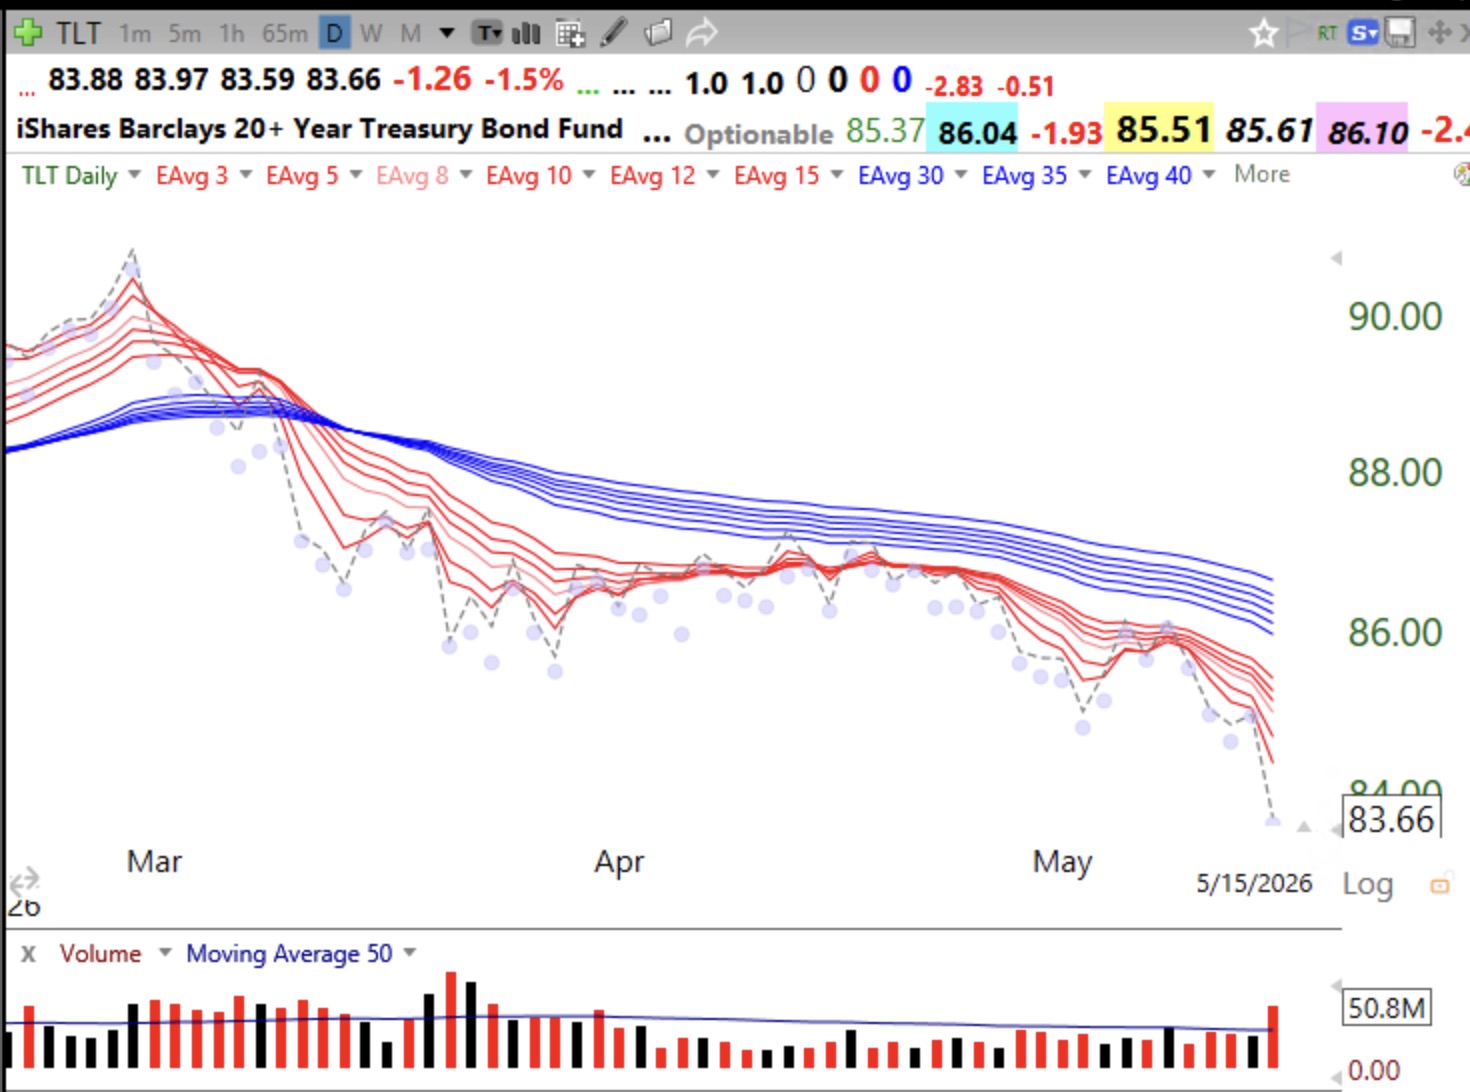
While the GMI=5 and GREEN, I am very worried about the market internals. There have been 3 days last week with 100 or more US stocks at new yearly lows, a huge departure from recent times. Theses 3 were the only such days since April 1! Before that the next day with 100 or more lows was March 20, with 153. I have found that when the market indexes are climbing to new highs and the new lows are also climbing, the rally is suspect. And now look at interest rates on the 20+ year US bonds. TLT is now in a BWR daily down trend and swooned on high volume last Friday. When bonds fall the interest rates rise. To understand this inverse relationship, think of it as being like a stock paying a dividend. When the price of the stock falls the yield which is a percentage of the price rises. For example, X pays $5 annually and is selling at $100, yield= 5/100 or 5%. If the price falls to $50, then the yield rises to = 5/50 or 10%. Most bonds pay a fixed dividend so that as their price declines the yield rises and visa versa. TLT dropped to 83.33 on Friday.
On Wednesday, NVDA reports earnings.There will be a lot of volatility. I will reduce risk on everything by Tuesday’s close. I need to protect my recent gains.
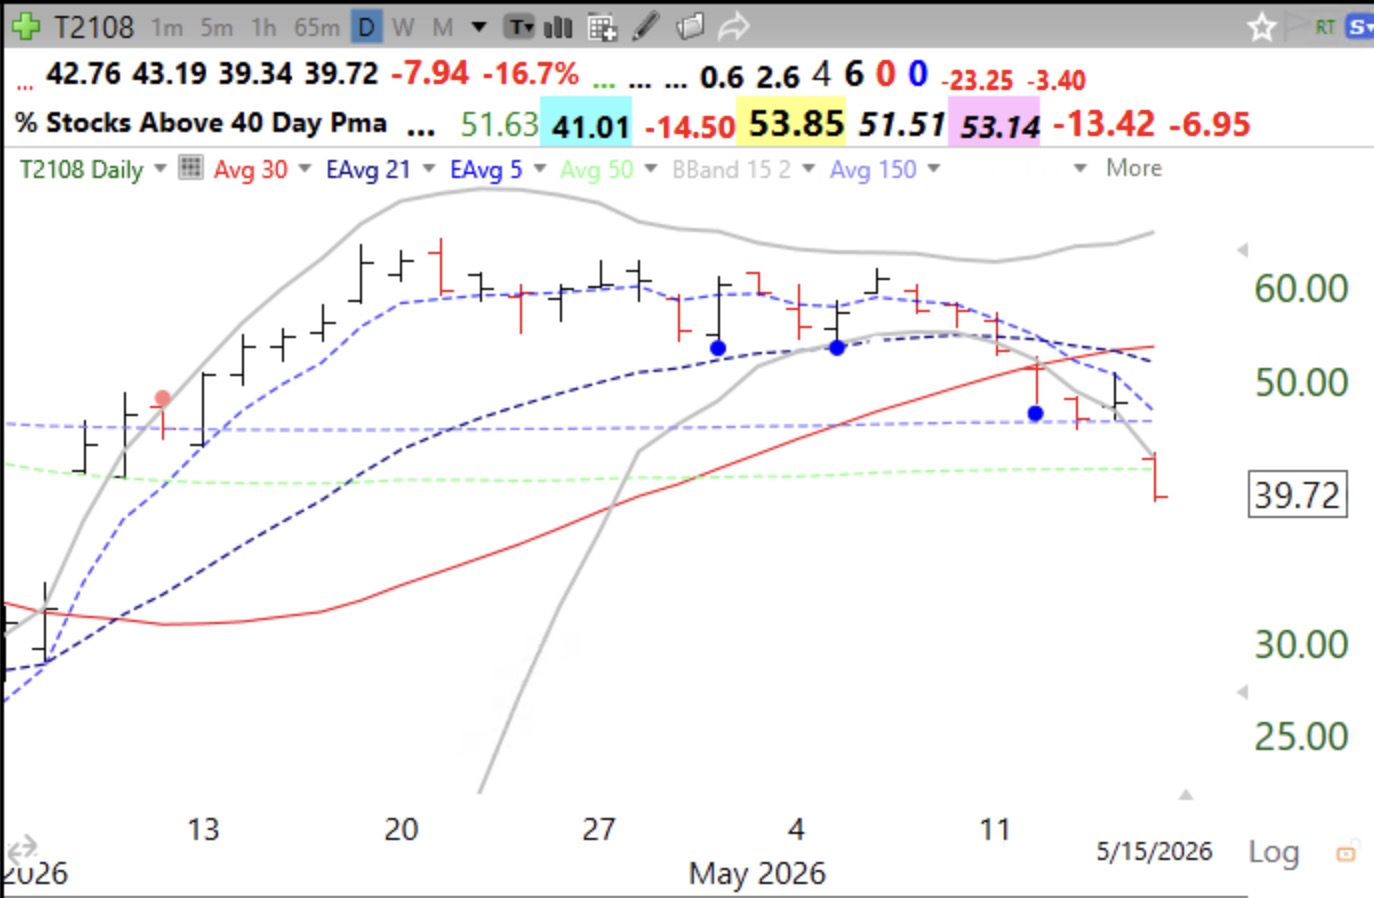
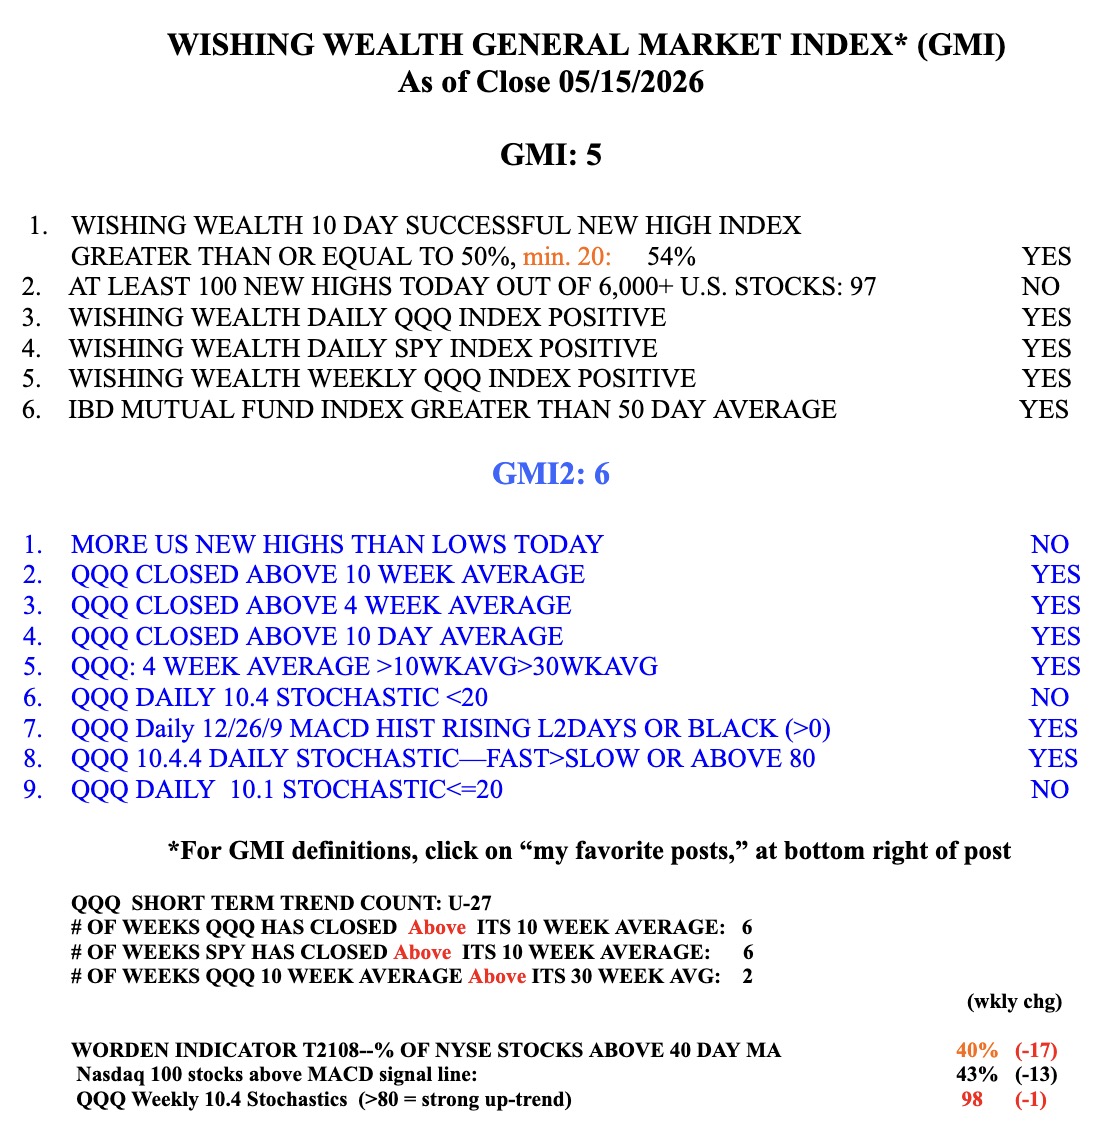
The GMI table shows that T2108 has declined to 39.72. That means that only 40% of NYSE stocks closed Friday above their 40 day averages, a major sign of general weakness.
The GMI table appears below.
Hey Morning Dr. Wish, I think what you teach and have develop is great especially offering it to the rest of us. But I have to admit for at least me personally, i get confounded with the guidance regularly. Yo have developed this methodology over decades and evidently your bank account is attributed to that. But it seems several times in the recent, the numbers get a bit faltering, you say (honestly I might add) your a chicken and you get out. Doc, either the numbers work and you got faith or the numbers are very rough guides and one’s on intuition and expertise should prevail. Which is it? I am really quite confused…