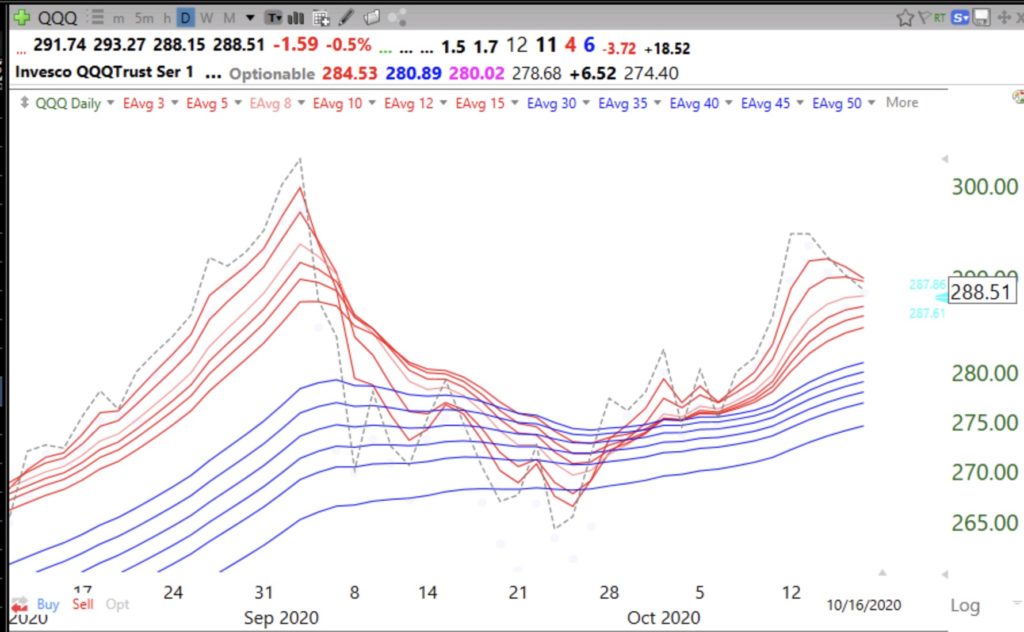
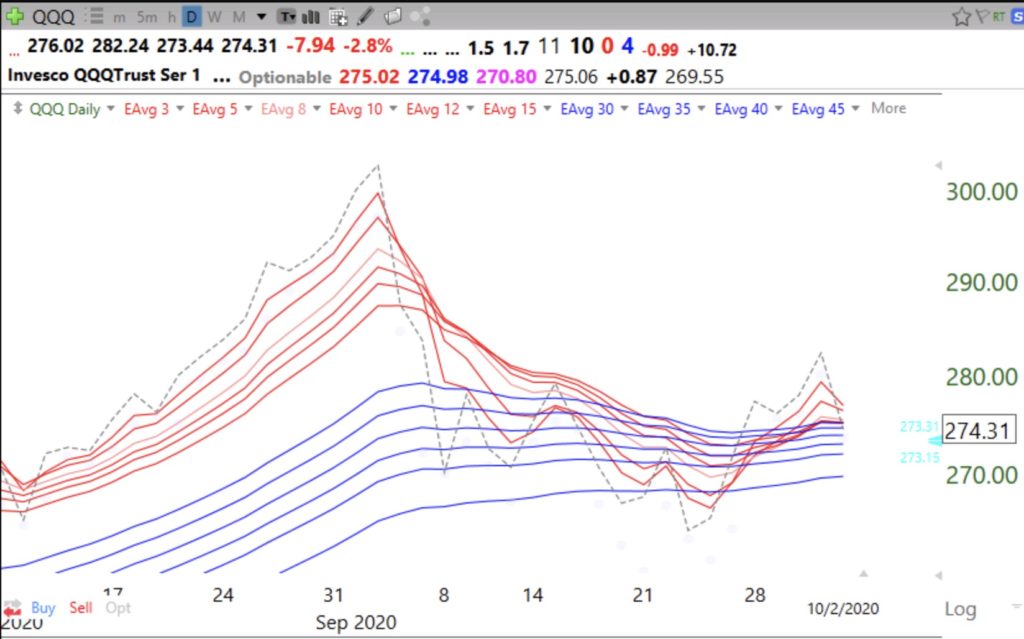
Are these three indexes forming cup with handle patterns? They all look the same as QQQ below. We will either get a break-out to ATH (all-time-highs) or a double top. Wait and see.
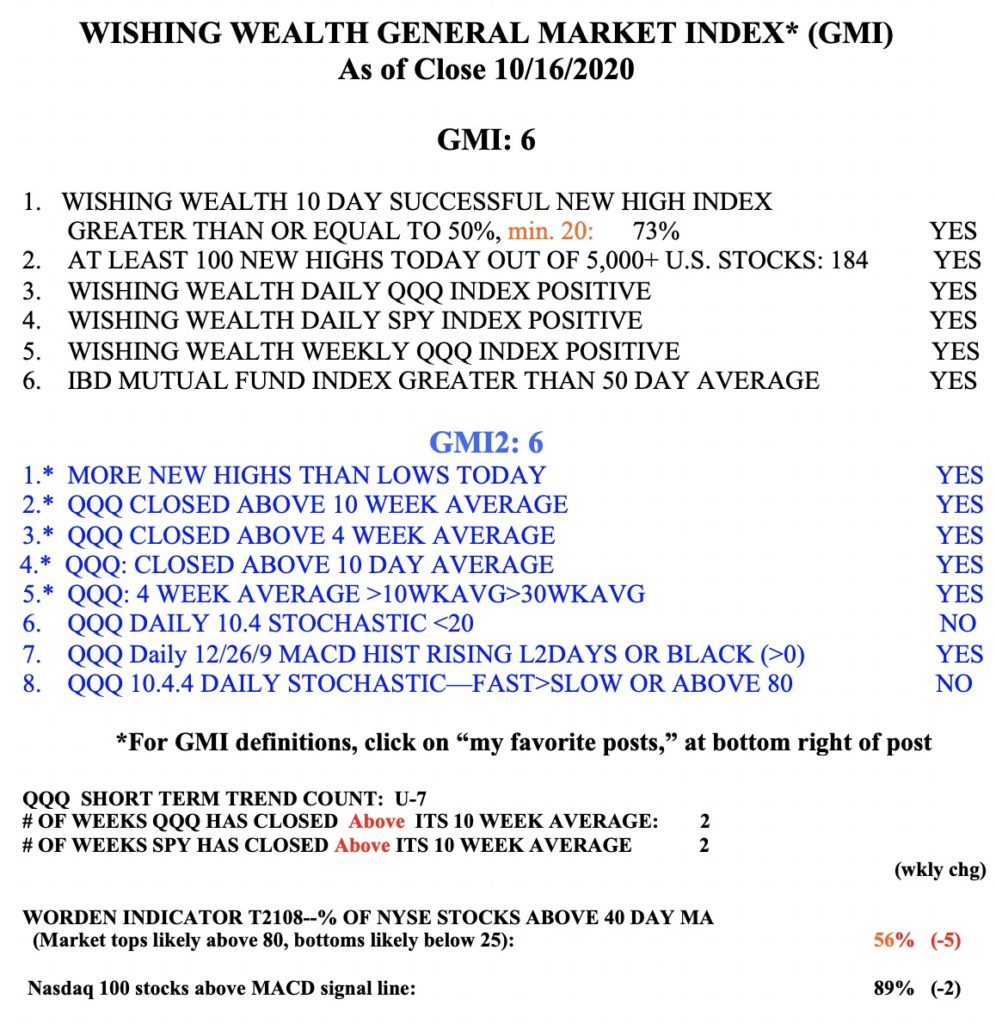
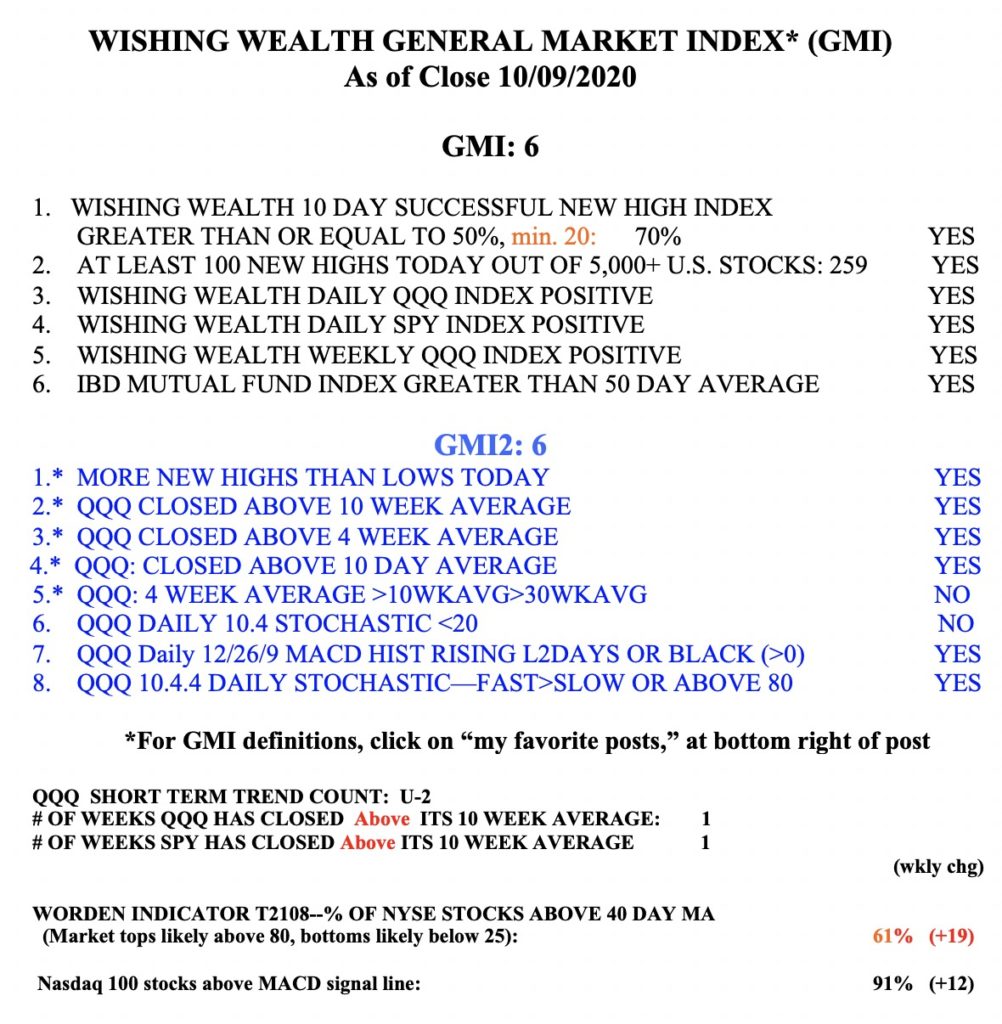
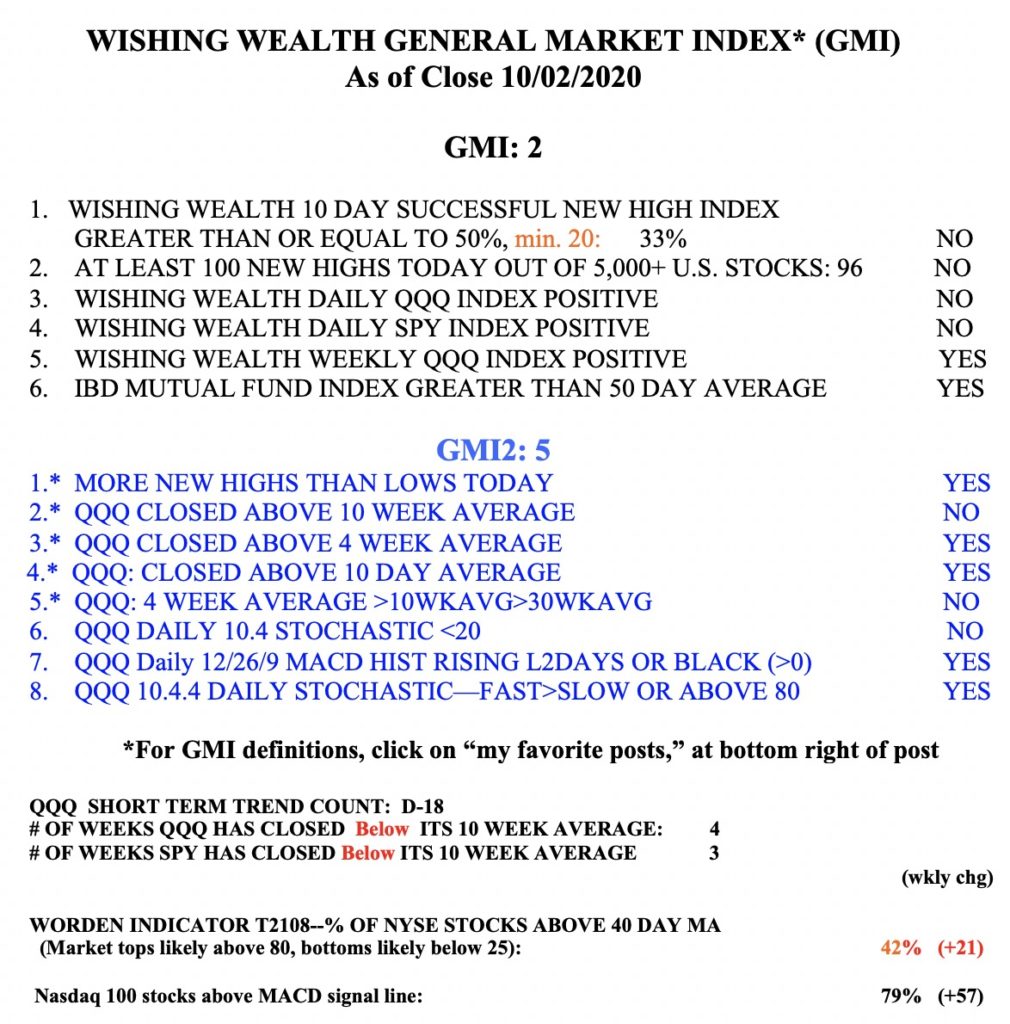
General Market Index (GMI) table
With GMI=Green and a $QQQ short term up-trend and daily RWB pattern in place, it is time for me to buy TQQQ and strong growth stocks; A look at $TSM, $EXPI, and $IIPR
I have learned to follow the market’s direction and to ignore the media or my personal opinions. My indicators have turned up and I must heed their message. QQQ, SPY and DIA have all retaken their critical 10 week averages. So I bought some TQQQ last week and will add to it if this new up-trend continues. A new up-trend is always met with skepticism because most people remain intimidated by the recent down-trend. If the up-trend should falter, I can exit with a small loss–without emotion and no ego involvement. TQQQ is the 3x bullish leveraged QQQ ETF. It is designed to move 3x as much as the QQQ—up or down. I have found many times that TQQQ will rise in a sustained up-trend more than 90%+ of individual stocks. Also, many individuaql stocks are breaking out.
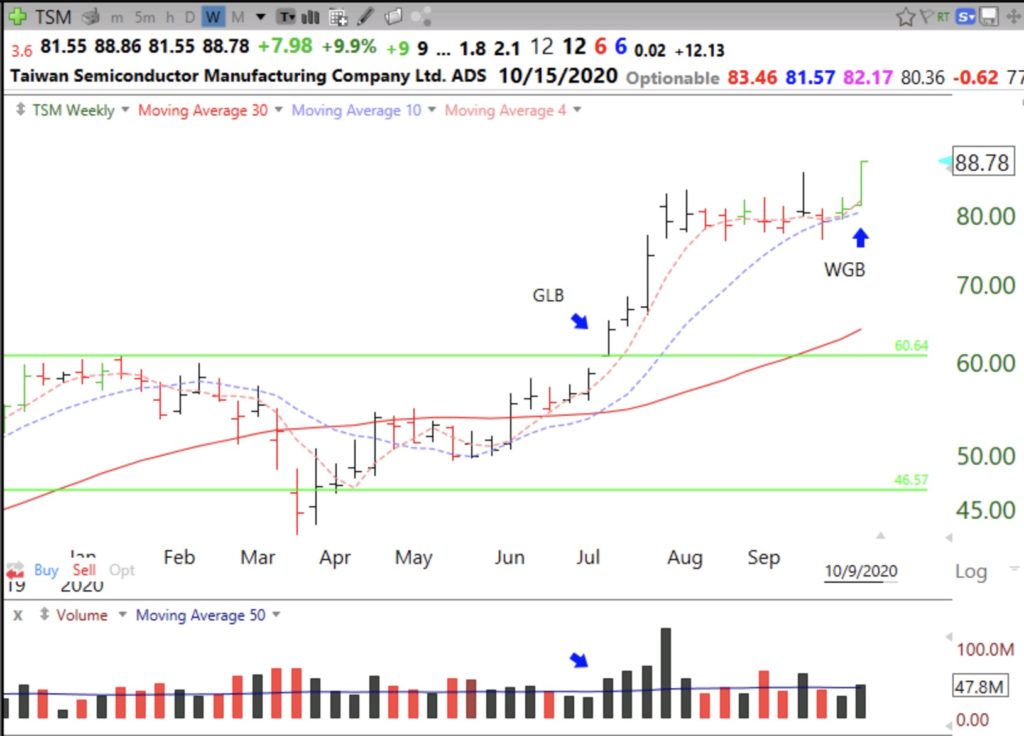
One of my former students texted me about TSM. This weekly chart shows that TSM had a green line break-out (GLB) to an all-time-high in early July at 60.64 and advanced for 5 weeks to $84(+31%). It then consolidated for 9 weeks until the break-out last week. Last week was a WGB (weekly green bar) signal. This means that the 3 weekly averages of price were lined up properly with 4wk>10wk>30wk and the stock bounced up off of its rising 4 week average (red dotted line). I like to buy such stocks and then wait to see if the stock holds its 4 week average. If it does, I hold and monitor the weekly chart for a close below the 4 wk and/or 10 week averages to exit. (If I watch the daily chart I often get shaken out of a good stock.) I might sell half of my position with a weekly close below the 4 wk average. Successful growth stocks can hold this pattern for months. I can add to my position on subsequent WGBs. I described a similar weekly pattern and my yellow band pattern during my 2012 Worden TC2000 workshop available for free at the webinars tab above on my blog or by clicking here.
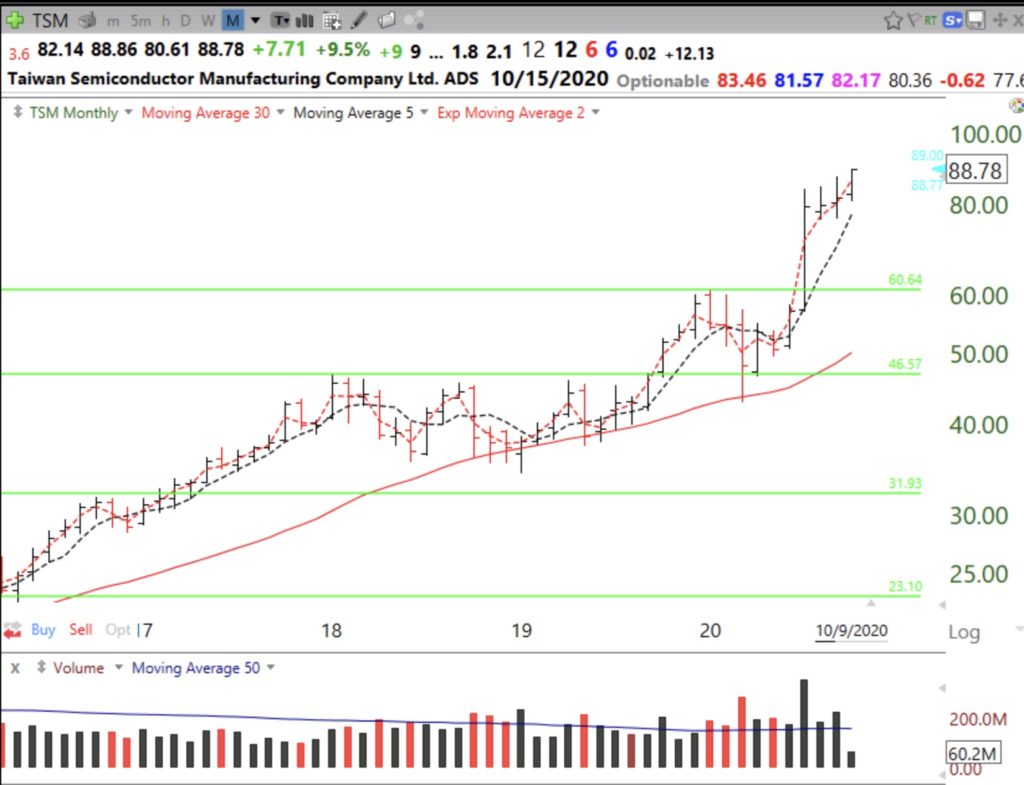
I always look at a stock’s monthly chart before buying. TSM’s monthly chart clearly shows the large volume GLB followed by a sideways consolidation.
I next checked TSM’s fundamentals and technicals on investors.com and MarketSmith. Taiwan Semiconductor’s Industry group’s rank=68/197, not too great. However, its IBD composite rating=97, EPS change last quarter=+93%, sales last quarter+36%, annual ROE=20.9%, price RS=92 and it has 7 quarters of increasing fund ownership. Earnings for 2020 are estimated to be +47%. TSM would be worthy of my consideration for purchase, but earnings are due to be released this week, on 10/15. I don’t hold over earnings unless I have a nice cushion on the stock. So I would not buy TSM this week even though the recent GLB suggests to me that earnings will be good. I hope my students will use this post to guide them as they learn about selecting stocks to trade in their virtual trading competition.
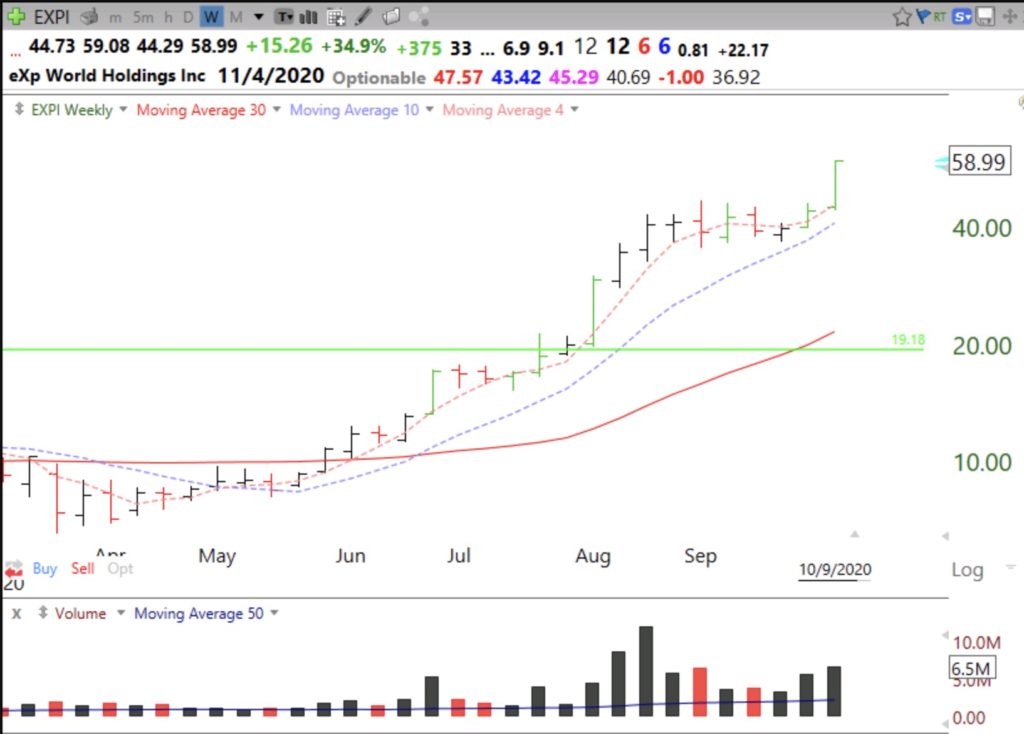
EXPI is another promising growth stock with a WGB last week. Note the similarity of this weekly chart to that of TSM above.
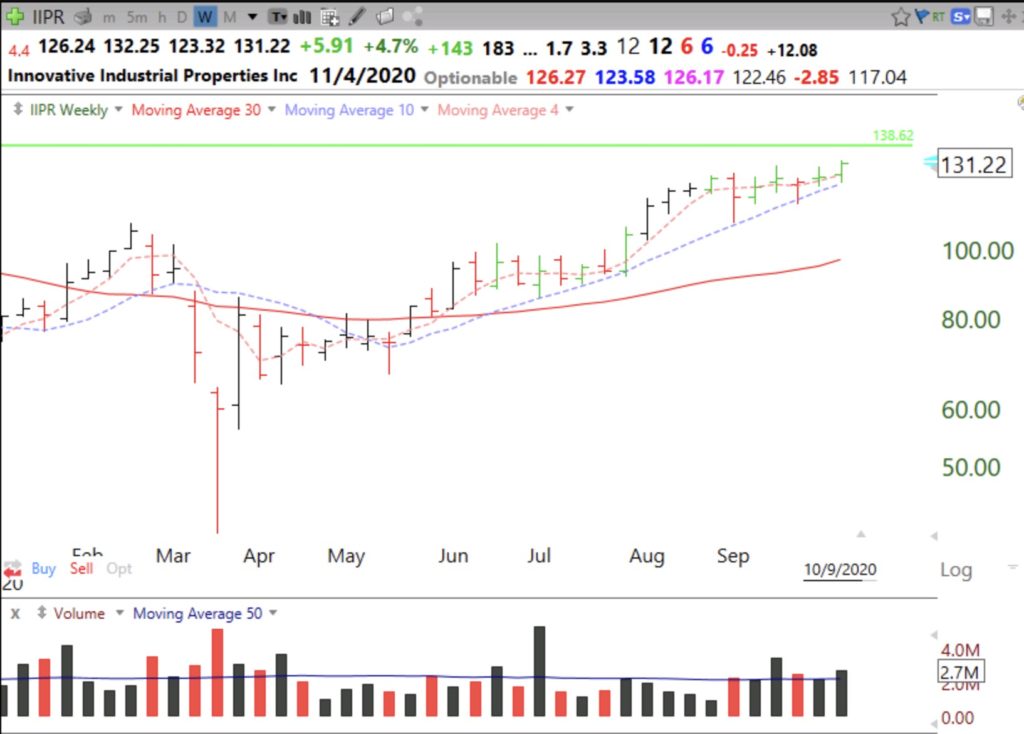
With 5 states voting on marijuana this November, It is also worth monitoring the marijuana-related stock, IIPR, which is heading toward a GLB and had a WGB last week. Note the large black volume bars. Let’s see how high IIPR can get, hah ha.
The GMI is at 6 (of 6) and remains on a Green signal.
How I used the IBD screener to identify 36 launched rocket stocks; Even so, the market remains in short term down-trend (D-18) with a Red GMI and a Daily RWB pattern did not form for $QQQ;
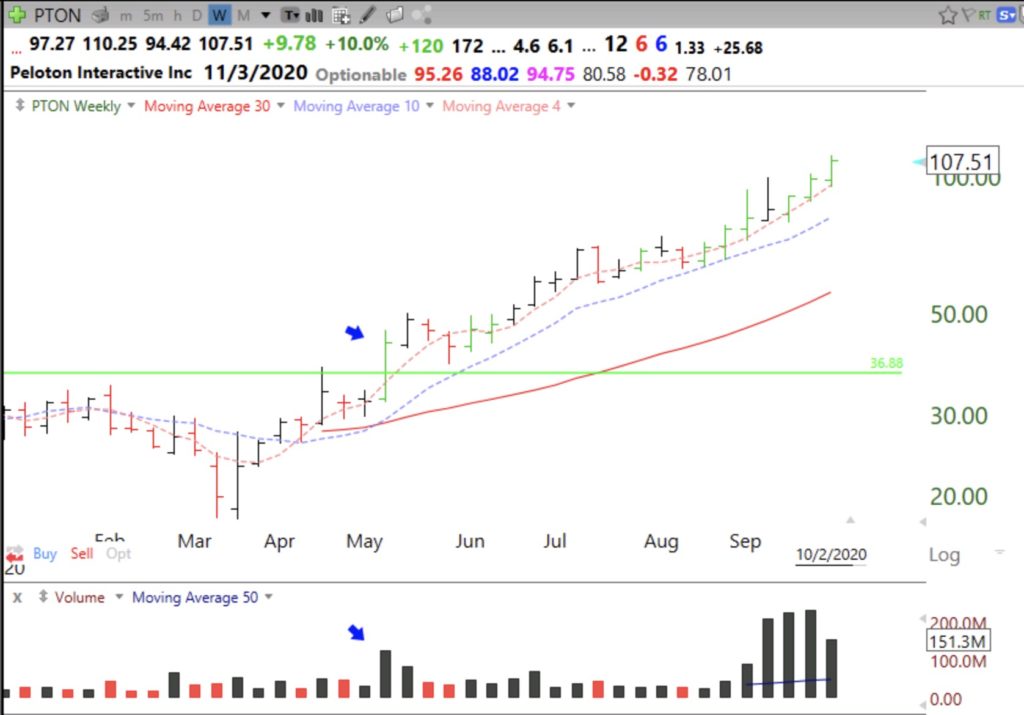
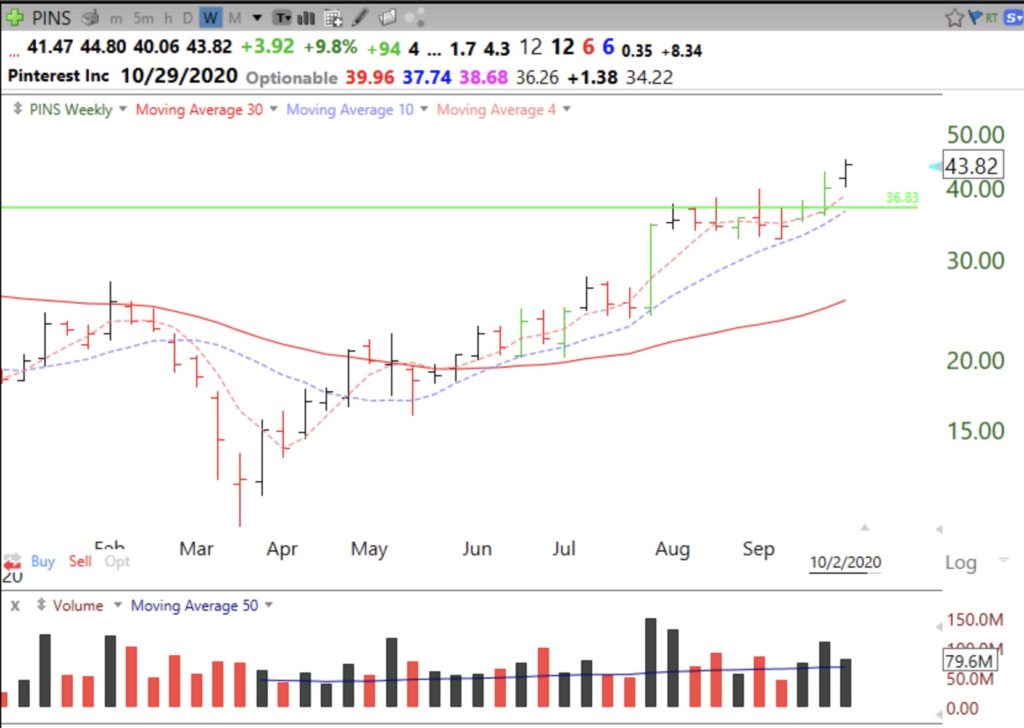
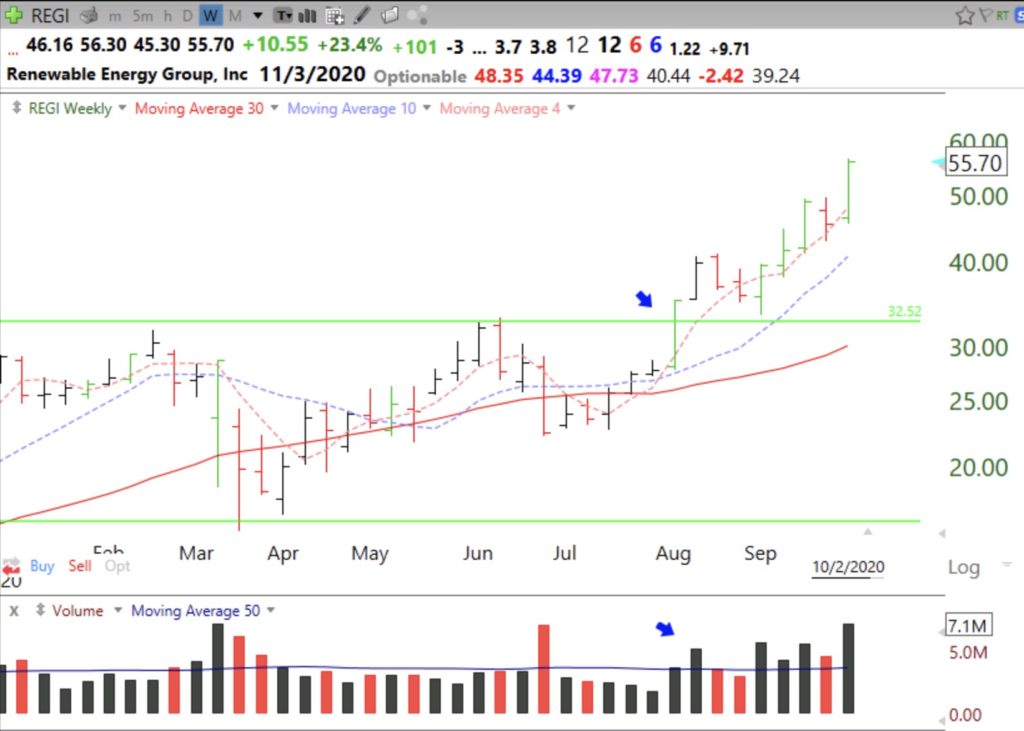
If QQQ (dotted line) declines below all 12 GMMA averages, lowest is currently at 269.55, then it will be time to exit all positions. For now, I hold a few rockets like PTON, PINS and REGI. Note their beautiful weekly charts. All are above their last green line tops at all-time highs (ATH).
I discovered many of these stocks through social media tweets or my own TC2000 scans. However, I discovered this weekend an easier way to identify promising stocks using the new IBD screener. There is a wonderful youtube video posted by my talented student, Richard Moglen (@RichardMoglen), that shows how to use the IBD scanner and export stocks to a TC2000 watchlist for further analysis. I tried the screener this weekend and found that the screen I built came up with 36 stocks out of more than 7.000 that met the four conditions I specified. Amazingly, many of the stocks I have been following came up in my first screen! You need to learn IBD’s CAN SLIM approach to understand the importance of the search criteria. William O’Neil’s classic book (How to make money….) is posted lower on this page. It is required reading for my students. I began to make money in the market after reading it and getting O’Neil’s newspaper, IBD.
I ran a scan with 4 IBD conditions: RS 90-99, ACC/DIS = A or B, Price >30, Next Quarter EPS est >100%. This search yielded 36 names which I exported to Excel and imported into TC2000 to evaluate and monitor. I am going to assign the use of the IBD screener to my current class of 90+ undergraduates. They will select criteria to find stocks to trade in the virtual trading exercise and evaluate the results. Among the 36 stocks identified by the screen above are: APPS, CRWD, DDOG, DQ, ETSY, FSLY, LVGO, NFE, PINS, PTON, REGI, W, Z, ZM and ZS. You will recognize many of them as being leading rocket stocks. William O’Neil and David Ryan teach people to buy great stocks with proven or expected large earnings increases. Great earnings propel stocks higher. I now have a watch list in TC2000 so I can monitor these 36 and set alerts for the technical set-ups I use. How great is that!
While some stocks are doing quite well, the general market indexes are not. The GMI remains on a cautious Red signal and QQQ and SPY are below their critical 10 week averages and the daily RWB up-trend pattern did not develop for QQQ last week.
