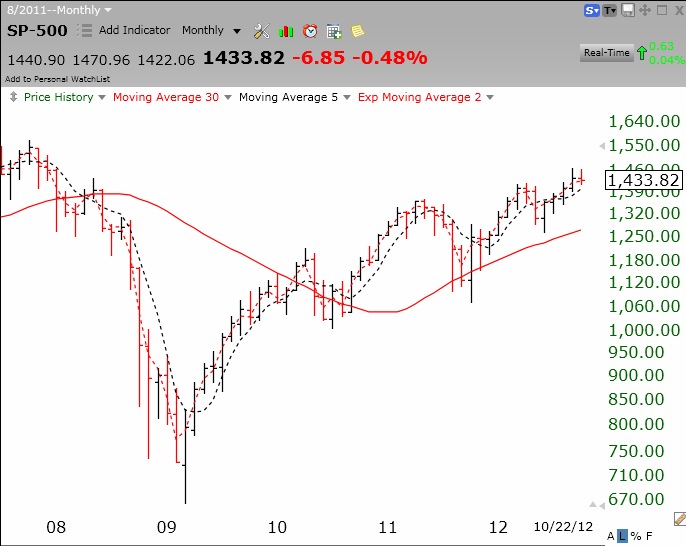
I am short (own SQQQ) or in cash in my trading accounts. The GMI has issued a Sell signal. The GMI2 is at 0, indicating short term technical weakness. The weakness in the leaders is a bad omen for the general market, and after three years, this bull market is showing its age. Since the end of March, 2009, the Dow 30 index has advanced +75%, the Nasdaq 100 +117% and the S&P500 +79%. What more can we ask for in a bull move?! Check out this monthly chart of the S&P500 index.
Dr. Wish:
would you please tell us what you do with your conservative account (pension mutual funds), because most of us have 401K that can’t be traded often.
thanks
Check out Monday’s post.
Dr. Wish – If you look at the monthly S&P 500 the 50 MA is at the 200 MA – the first occurrence, if it goes negative, with the TC2000 data (my chart goes back to 1971 or so, a negative crossover on a monthly basis, 50 MA dips below the 200 MA).