I am reprinting below some of my writings from a few years ago in order to give my new students some understanding of my approach to the market.
“it is utterly useless for us on the outside, who buy and sell comparatively small blocks of stock, to conjecture about what “they” are doing. We cannot know what the insiders intend to do, but we can see their orders on the tape when they execute them. That is why my plea is for everyone of us to have no mere opinions of his own, but to allow the actions of the market to tell him what is passing.”
(Humphrey B. Neill, Tape Reading & Market Tactics, 1931, New York: B.C. Forbes Publishing Company; 14th printing, 2003, Vermont: Fraser Publishing Company)
When Nicolas Darvas was interviewed by Time Magazine in the early 60’s and it came out that he made almost 2 million dollars in the market in 18 months (while he was dancing around the world!), he noted that he read and reread Neill’s book (along with Gerald Loeb’s). Neill’s book has been reprinted many times and I happened to find it on the shelf of my local Barnes and Noble store. Neill dedicates his book, “to my losses, with a deep appreciation for the experience and knowledge which each loss has brought me.”
If anyone tells you that the market is different today, refer them to the successful traders from the 1929 post-crash era–Livermore, Baruch, Loeb. Darvas, who made his fortune in the 60’s, clearly learned something from Neil’s original writings–and so have I. (See list of books about these people to the lower right of this page.) Livermore used to say that when you have a losing trade, you were paying the tuition required by the market. As a college professor, I sometimes see students who pay tuition (more accurately, their parents pay) but are not focused on learning. Losses can provide knowledge–but you have to study them.
Perhaps the most important thing I did a few years ago was, after a series of losing transactions, to print out their charts and write down my precise buy and sell points. It looked like I had followed exceptionally accurate rules that flawlessly led me to buy at the top and sell at the bottom of moves! So what did I do? I reversed what I was doing and began to trade profitably. Every great trader (including IBD publisher William O’Neil) urges us to study our losses. However, most of us rarely do this important exercise in the market, or in other areas of our lives.
So, one of the major exercises that my class completes during the semester is to trade for nine weeks in a trading simulation with a pretend $100,000 margin account. They must keep careful records of all of their transactions and analyze them after the trading simulation ends to determine the technical mistakes behind their losses. They then revise their rules for entering and exiting positions. We should all review our transactions at least once per year……..
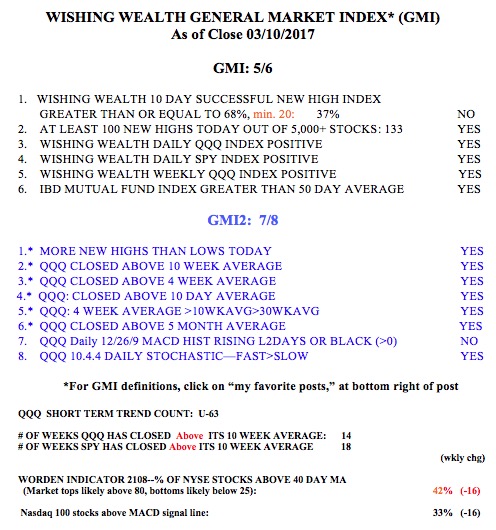
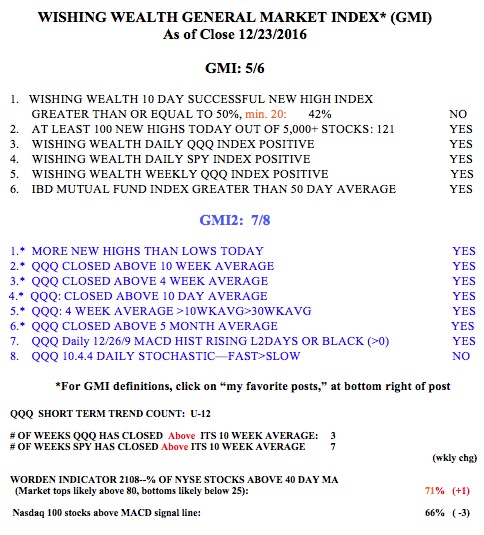
Meanwhile, the GMI and GMI-R remain at their maximum values.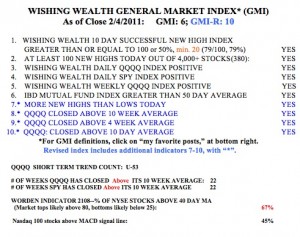 These two sets of indicators keep me on the right side of the market. Most stocks follow the trend of the general market averages and it is absurd to fight the trend. There were 380 new 52 week highs on Friday in my universe of 4,000 stocks. Buying stocks at new highs has been a good strategy lately; 79% of the stocks that hit a new high 10 days ago closed higher on Friday than they closed 10 days ago. The QQQQ (Nasdaq 100 Index) has been in a short term up-trend for 53 days. And the longer term up-trend of the SPY (S&P 500 index ETF) and DIA (Dow 30 index ETF) has lasted for 21 weeks. The Worden T2108 indicator is at 67%, in neutral territory. 45% of the Nasdaq 100 stocks closed with their MACD above its signal line, a sign of short term strength.
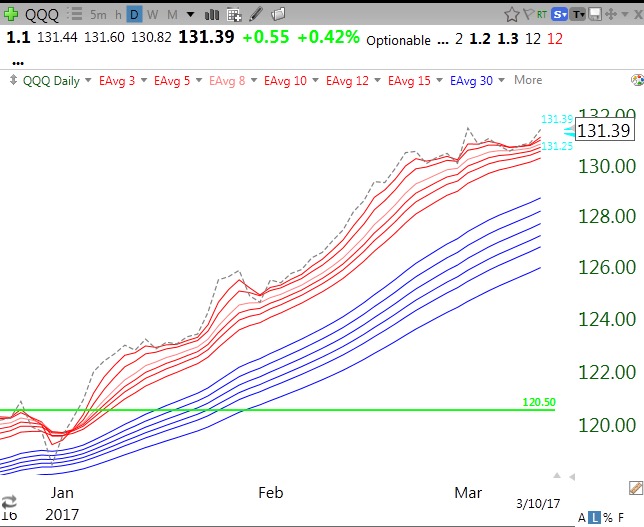
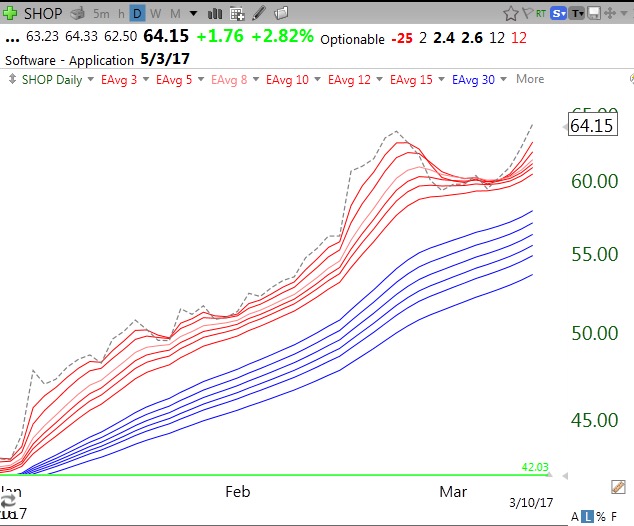
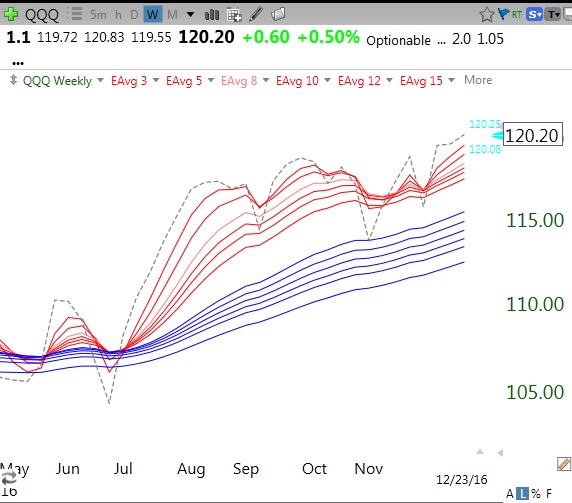
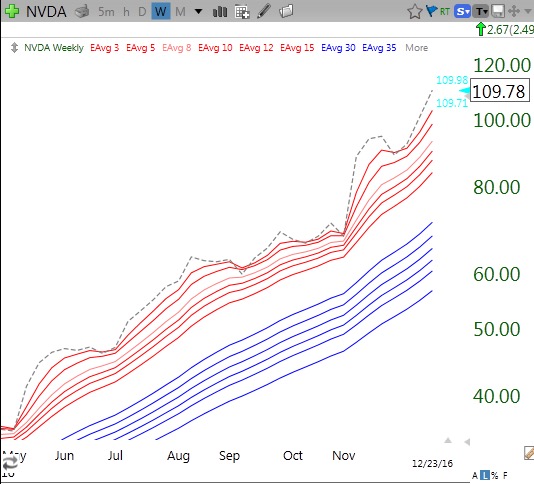
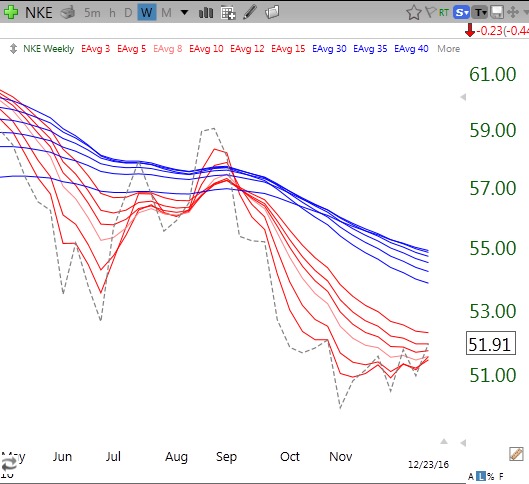
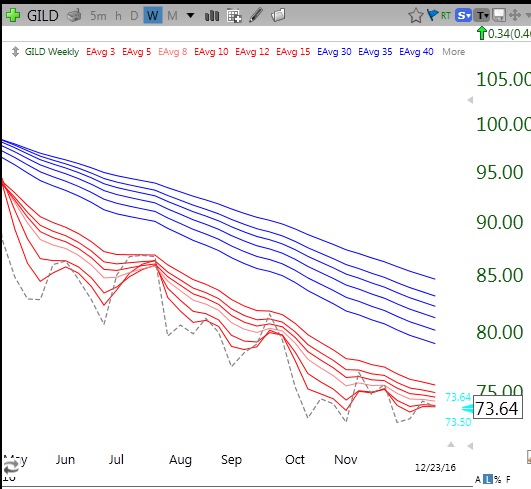
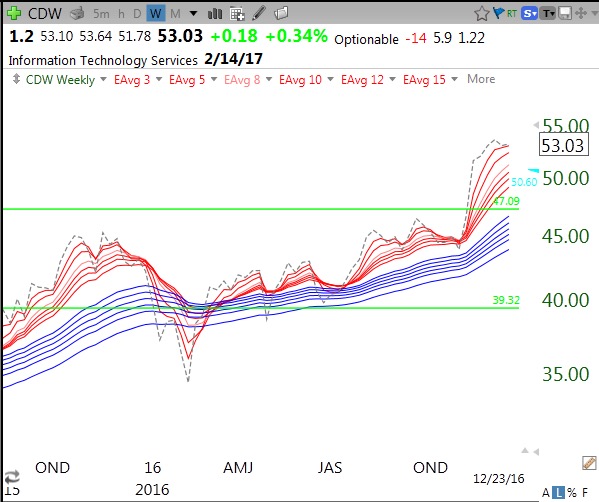
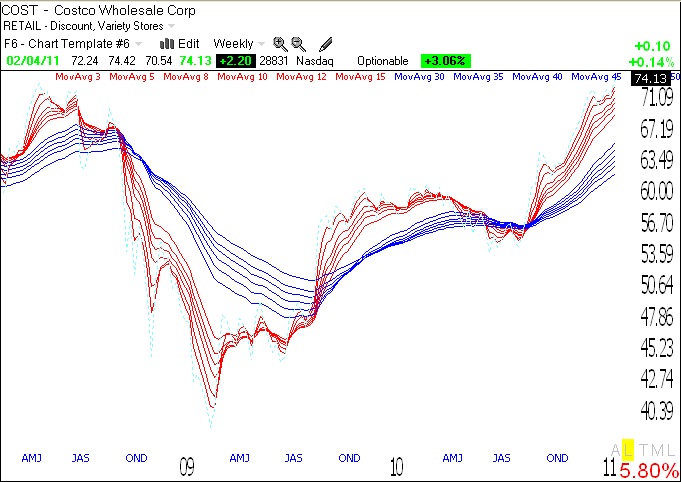
It is therefore okay for me to have long (versus short) positions in this market. My scan of the market has found a number of promising candidates. Below is the weekly GMMA chart for COST. An RWB stock has all of its short term averages (red) above its rising longer term averages (blue). This is a pattern of a stock in a strong up-trend. COST closed on Friday at $74.13, very close to its all-time high of $75.23. A close above $75.23 could be a sign of considerable strength for COST. COST reports earnings on March 2nd.

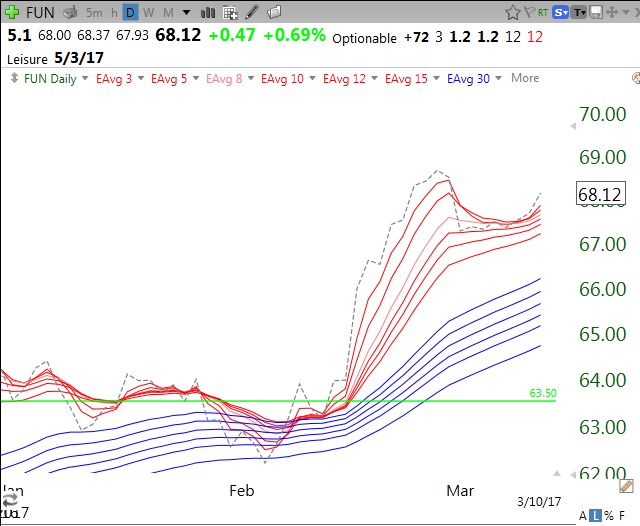
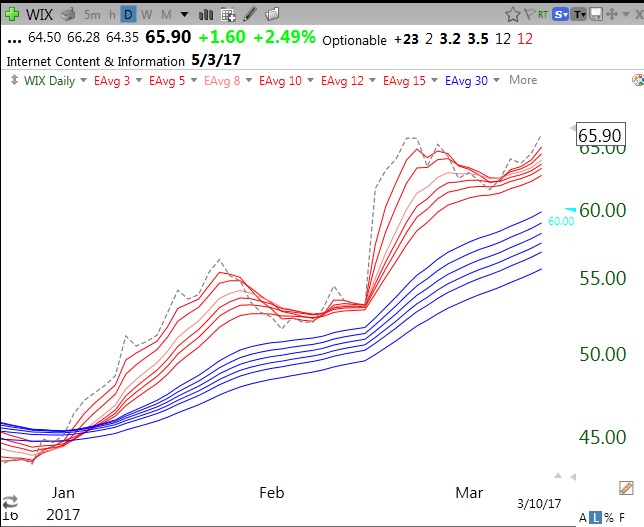
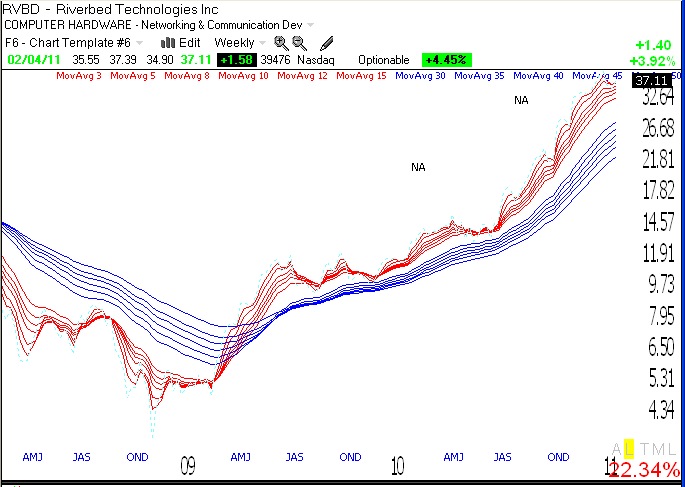
Another RWB stock with a nice chart pattern is RVBD. It looks like it bounced off of support recently and is not far from its all-time high. If I bought RVBD, I would place a stop loss below its 30 day average, around $34.95. The two “NA’s”on the chart indicate when IBD wrote about this company in its New America column, highlighting promising visionary companies. Next earnings for RVBD come out in April.
By the way, all of my students are required to get a student subscription to IBD and to read the newspaper daily. IBD provides an abundance of technical and fundamental information about the types of growth stocks I buy. Furthermore, most of my purchases come from stocks on their prior IBD 100 lists, now superseded by the IBD 50 list. I never consistently made money trading until I started reading IBD in the 1980’s.