Reader comment, received 11/23:
I have used your blog as part of my trading strategy over the last six months. The CANSLIM method depends on the direction of the market. Your indicator is something that I look for in order to determine whether or not I am in the market. I use a number of
indicators and yours is the "tie breaker". Thank you!…………………………………………….
I use the GMI the same way as the above reader–to determine whether to be in the market on the long or short side. I always trade consistent with the GMI…………………………………
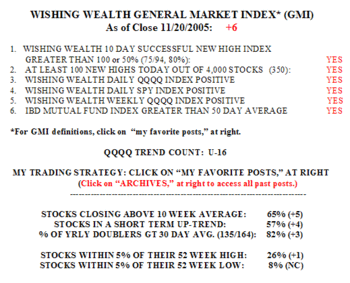
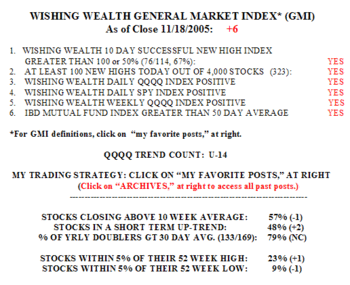
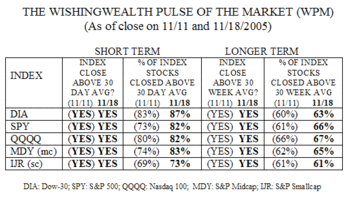
This market keeps humming along in a nice up-trend. The GMI remains at a maximum +6 and detected this rally in its early stages. 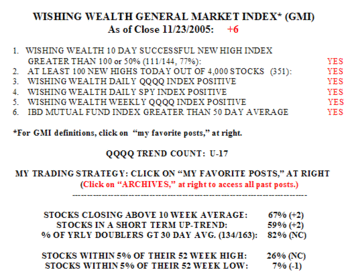 Growth stocks at new highs have been strong. There were 111 stocks that hit a new high 10 days ago that closed higher on Tuesday than they did 10 days earlier. There were 351 new yearly highs in my universe of 4,000 stocks and 82% of the stocks that doubled in the past year closed above their 30 day averages. More than three times as many stocks (26% vs. 7%) are within 5% of a new high than a new low. Two thirds of stocks closed above their 10 week averages and 59% are above their 30 day averages. The Nasdaq 100 stocks lagged the market on Tuesday again, with 54% gainers, compare with 65% of the S&P 500 stocks and 77% of the Dow 30 stocks………………….
The monthly chart of the market can provide a context for the current trend. This monthly chart of the Nasdaq Composite index 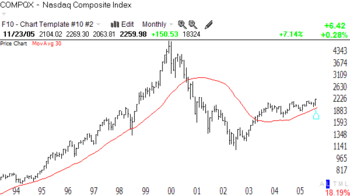 presents a revealing picture of the strong uptrend from 1994-2000, followed by the substantial decline that bottomed in 2002. Since the initial rise from the 2002 bottom, the Nasdaq has been basing with a slight up-trend. The 30 month moving average (red line) has finally complete a rounding bottom and appears to be on the rise. No one knows how long this up-trend will last. However, to me, this pattern does not justify the fears expressed by many media pundits that the Nasdaq has come too far too fast. While we clearly are not following the path of rapid increases that occurred from 95-2000, the Nasdaq market does appear to be in the early stages of a long term up-trend.
NOTE: A NEW SECTION TO THE BOTTOM RIGHT PROVIDES LINKS TO MY FAVORITE PRIOR POSTS. THESE INCLUDE MY STRATEGY POSTS, DEFINITIONS OF THE GMI COMPONENTS, AND MY ANALYSIS OF WHY THE TRADING TECHNIQUES OF THE GREAT NICOLAS DARVAS WORK BEST DURING BULL MARKETS AT ALL-TIME HIGHS.
How have you used this site to inform your trading? Can you send me some experiences I can post for others (anonymously, with your prior permission)? Please send your pearls of Wishdom to me at: silentknight@wishingwealthblog.com.
