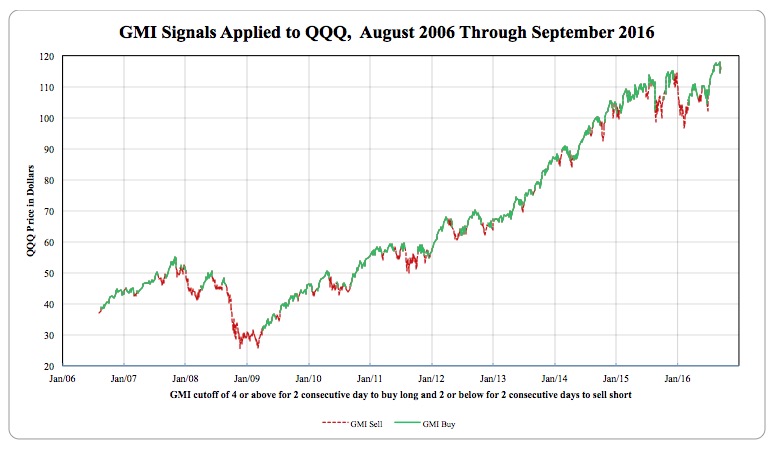
Below is a plot of the QQQ during periods when the GMI was on a Sell (red) or Buy (green) signal. Decide for yourself if this signal would have helped you stay out of bad markets, as it did for me. The GMI signals are rather conservative because the GMI tends to turn green well after the bottom of a major decline and a new up-trend has become firmly established. It also tends to turn red well after market tops. Such is the nature of trend following indicators!
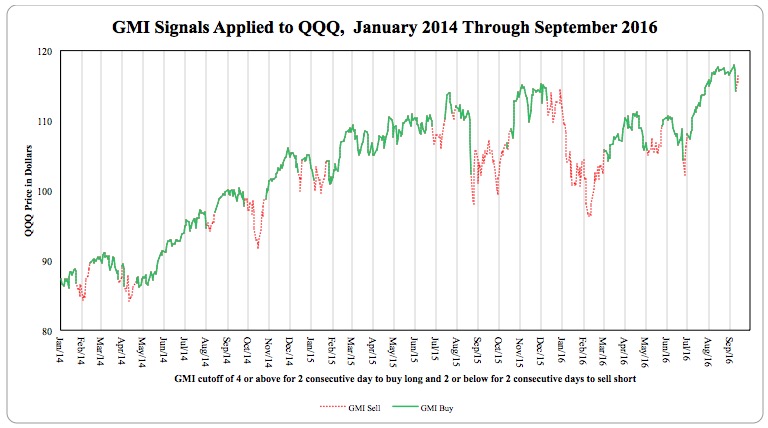
A plot of the shorter time period, from 2014-2016, shows more clearly that while the GMI is red during longer declines of the QQQ, it has had a number of times when it turned red right at the bottom of a very brief decline. I therefore do not necessarily exit all positions when the GMI flashes a “Sell” signal but look at additional indicators for confirmation. I am therefore changing the GMI signals from Buy/Sell to Green/Red. Green signifies to me that conditions favor being in stocks, while Red means the opposite and that extreme caution is needed.
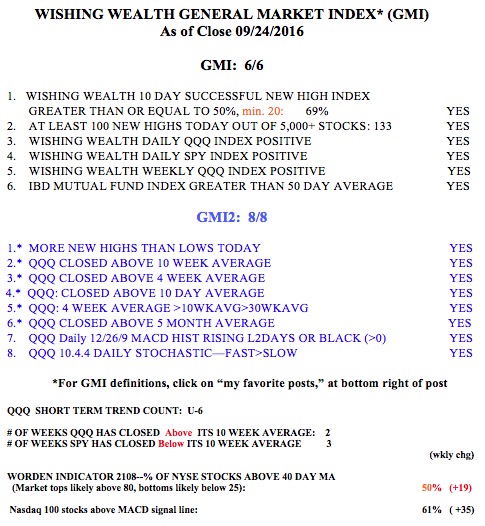
Speaking of short declines, the GMI turned Green at last Thursday’s close after being Red for just 8 days. As noted in the charts above, the GMI turns Red after registering 2 consecutive days below 3 and turns Green after 2 consecutive days above 3.
All of the indicators measured by the GMI and GMI-2 are currently positive. In addition, Friday was the 6th day of the new QQQ short term up-trend, which is assessed differently than the GMI signals. Note that the SPY is still (for 3 weeks) below its critical 10 week average.
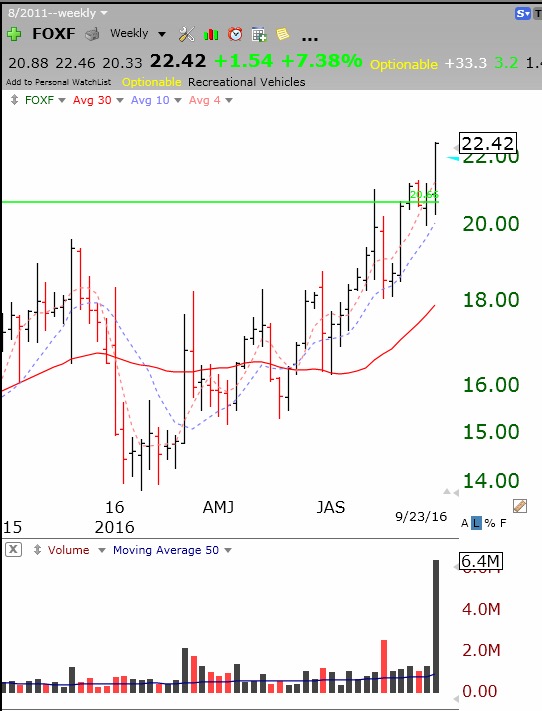
FOXF had a GLB on its highest weekly volume since it came public in 2013. FOXF is being added to an index ETF.
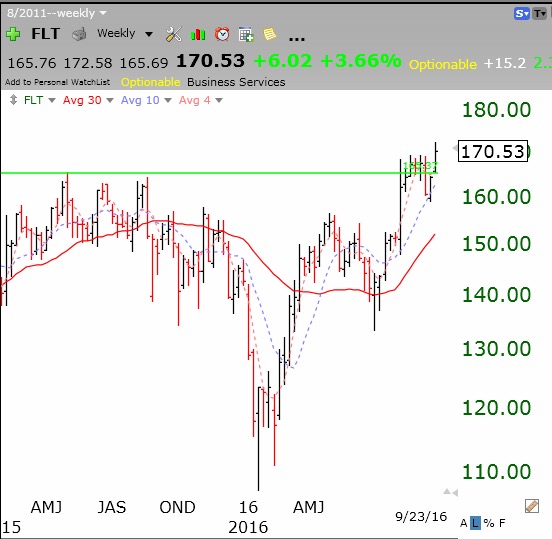
FLT also had a GLB last week.