The short term indicators in the GMI-2 are all positive even as the GMI signal remains Red. It remains to be seen how this stalemate will be resolved.
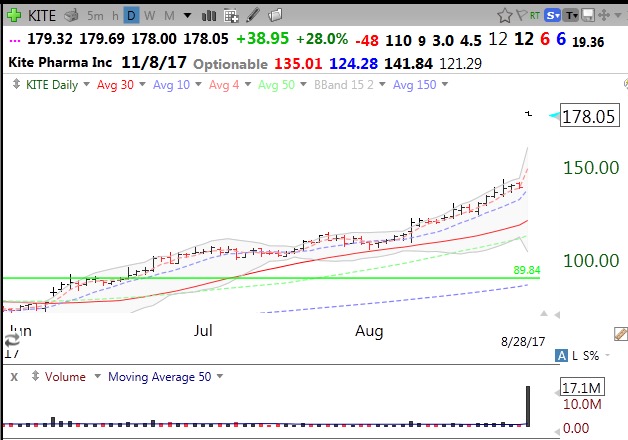
My blog malfunctioned yesterday. I had written Tuesday morning about how it was announced on Monday morning that my stock buddy’s (Judy) favorite biotech will be bought out by Gilead. Judy had been talking about KITE’s innovative cancer fighting technology for years. She recently tweeted about the publication of the results from one of KITE’s pioneering studies (receive her tweets: @Judyfr262). Apparently Gilead agreed…. Here is KITE’s daily chart from Monday, after it gapped up +28% on the buy out announcement. Note the GLB signal in June 🙂 Buying a stock at a green line break-out (GLB) to an all-time high can work! Judy, of course, bought much earlier and lower.