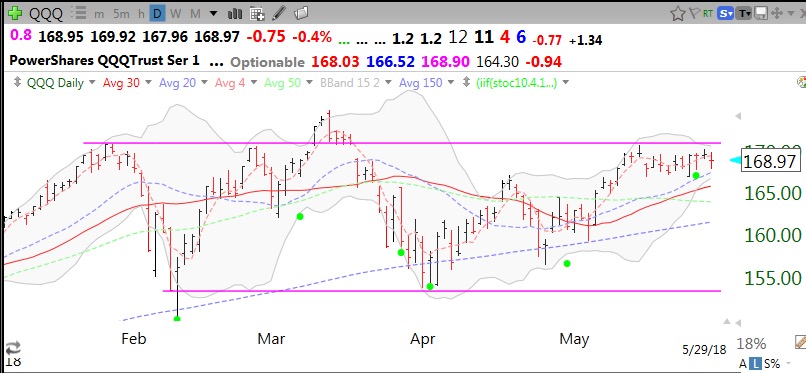
$QQQ making another attempt to break out of channel
This daily chart of the QQQ shows it is heading back up to resistance. Note the daily 15.2 Bollinger bands are heading towards each other and forming a pinch. The QQQ will likely break big, in either direction. The recent green dot signal is a possible sign it will move up. Friday was the 18 day of the current QQQ short term up-trend.
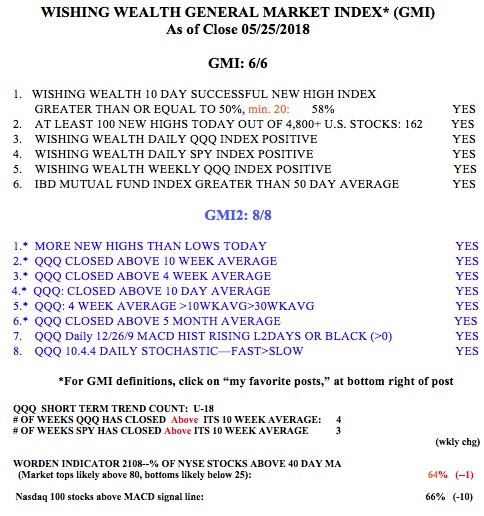
The GMI remains Green and registers 6 (of 6).
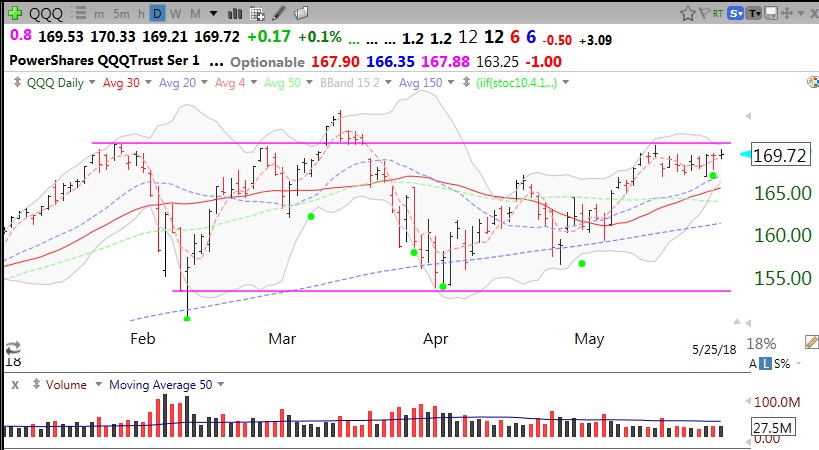
17th day of $QQQ short term up-trend
Three day weekend coming. Markets closed on Monday, good time to take stock of one’s account 🙂