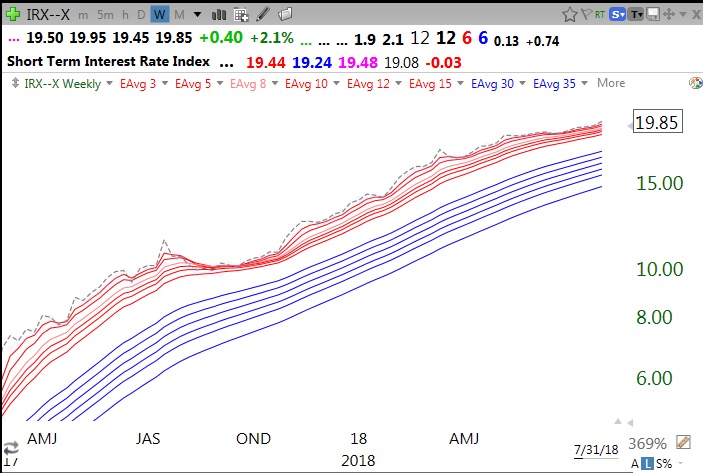
Waiting for green dot signal for the QQQ to turn up. But look at the sustained weekly RWB up-trend in short rates.
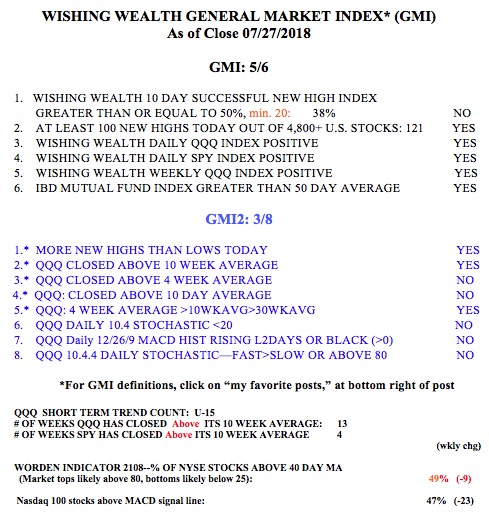
Stock Market Technical Indicators & Analysis
Waiting for green dot signal for the QQQ to turn up. But look at the sustained weekly RWB up-trend in short rates.
My indicators, while weakening, are not yet at oversold levels and the daily stochastic is declining. The QQQ closed below its 10 week average (blue dotted line) but remains well above its rising 30 week average (red solid line) and in a Stage II longer term up-trend. Stay tuned.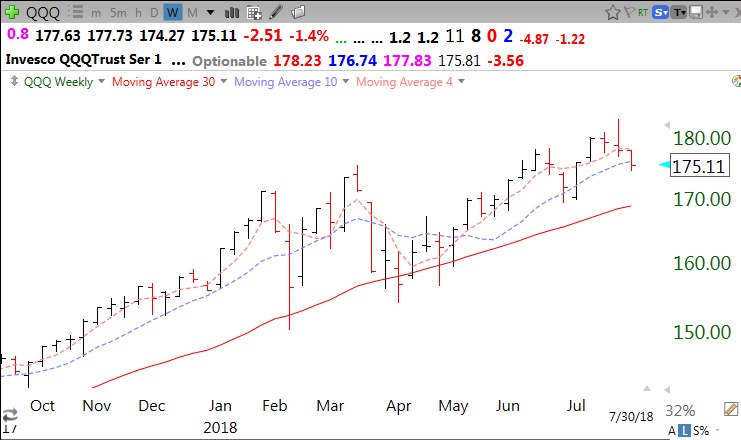
I remain very defensive having had so many recent set-up failures. I am mostly in cash.