If you check out my TraderLion 2022 presentation you will find that I made the case that most of the stocks that Bill O’Neil graphed as among his greatest winners were stocks that had bases at or approaching their all-time-highs (ATH). If you want to ride a stock to the moon one needs to get on a launched rocket that is hitting a series of ATHs. I recently developed a column scan on TC2000 that helps me to find such stocks. I sought to locate stocks that are within 5% of their recent ATH. In that way I find stocks that have already had a GLB (green line break-out) or those that are somewhat below their recent ATH. I can then look at their individual charts, draw in the green lines and look for opportunities.
I create a column I call <5% below a recent ATH. My first filter is a condition built into TC2000 called Price New High. I select that condition and set it to monthly, 500 bar high within the last 3 bars or months. (I am content to look over the past 41 years.) My second filter is set to daily with the formula: h>.95*maxh60 (today’s high price is greater than 95% of the maximum high in the last 60 days). ( I am looking for a stock that hit a 500 month high in the last 3 months and for today’s high to be within 5% of that peak high price.) To get rid of junk, I add the conditions C>30 and V>10000. That means I only find stocks with these conditions that are today >$30 and traded >10000 shares today. Of course there is nothing sacred about these values and one may change them as s/he sees fit.
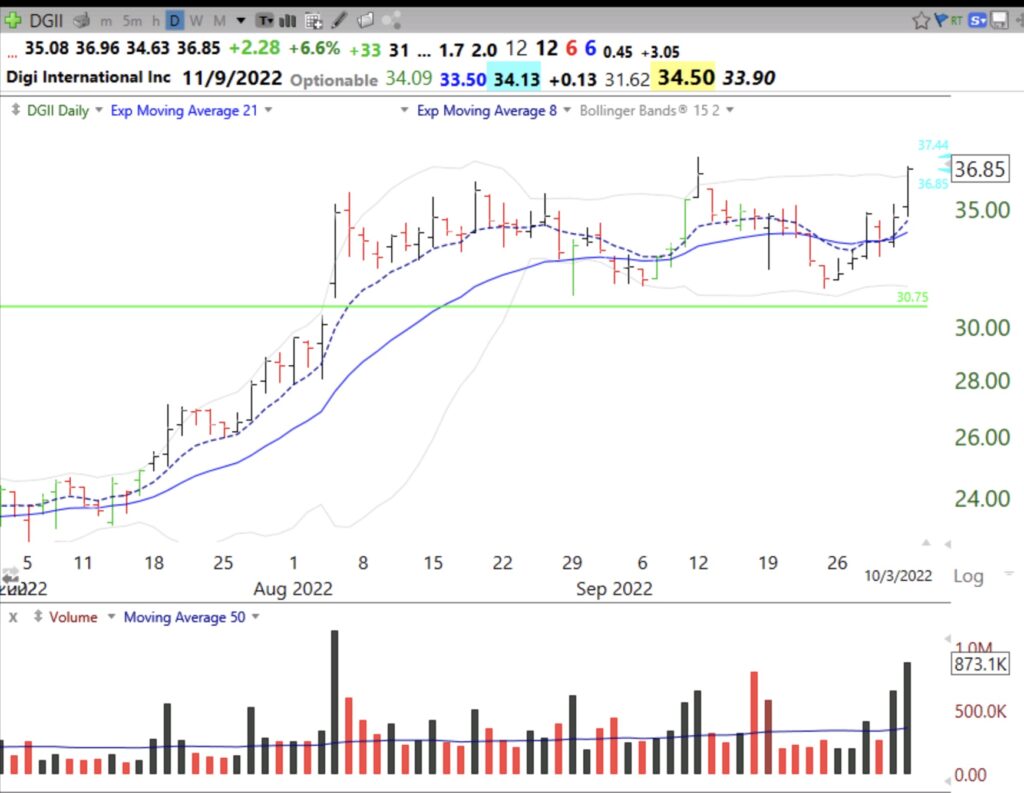
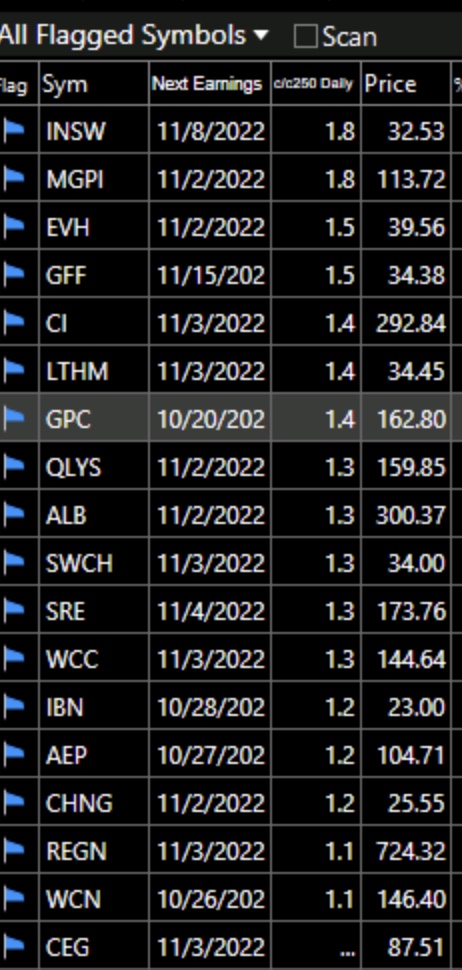
When I sort this column on my MS/IBD watchlist of 894 stocks I get 24 surviving stocks. I next looked at each on a monthly chart and drew in a green line at a monthly bar at an ATH that has not been surpassed for at least 3 months. With the green lines drawn I next look at weekly and daily charts for possible bases and break-outs. I also look at those stocks that went up today on above average volume. That is how I found DGII. DGII had a GLB in August and formed a base. Today it broke out of that base on above average volume. It still needs to surpass the high reached 15 days ago. DGII has great fundamentals on MarketSmith: EPS=98, Comp=99, RS=99. It will be interesting to see if DGII can continue higher or if the market keeps it down. It is already up 70% from a year ago. DGII is worth watching to see if it qualifies as one of those beach balls being held under water by the market which will explode upwards when the pressure comes off.
