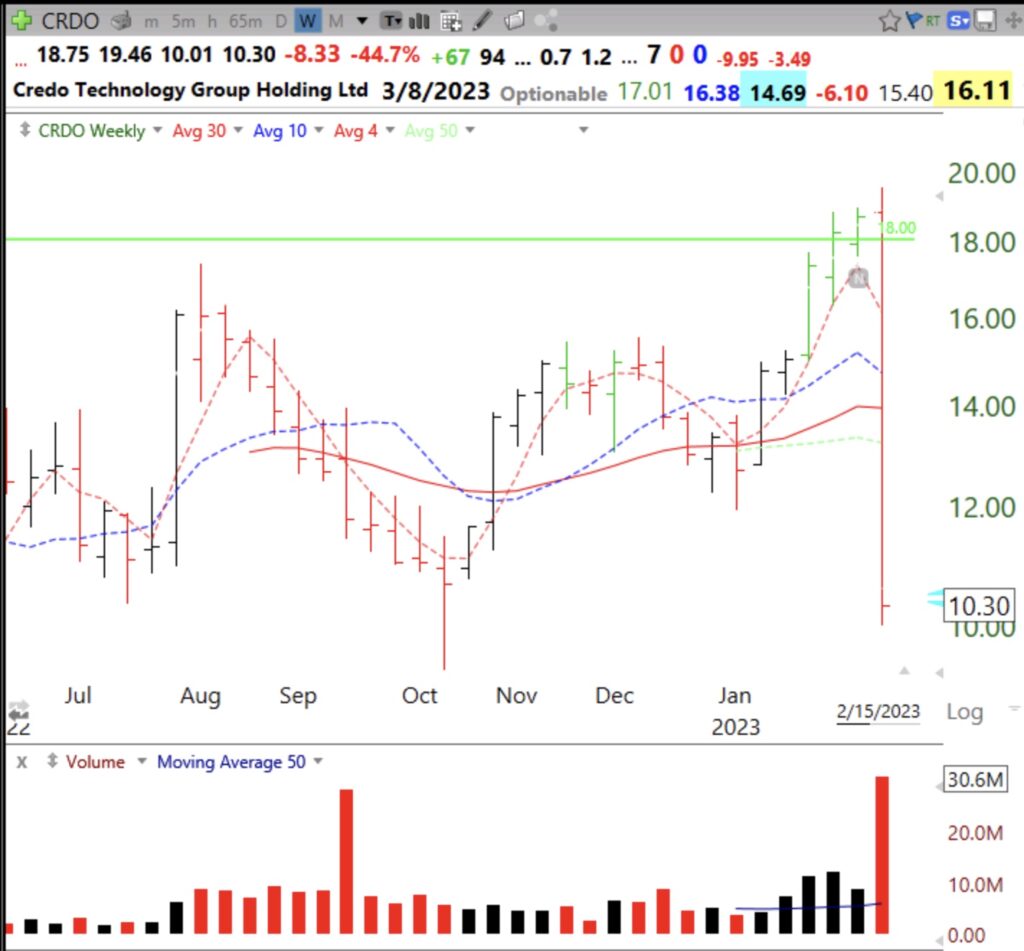
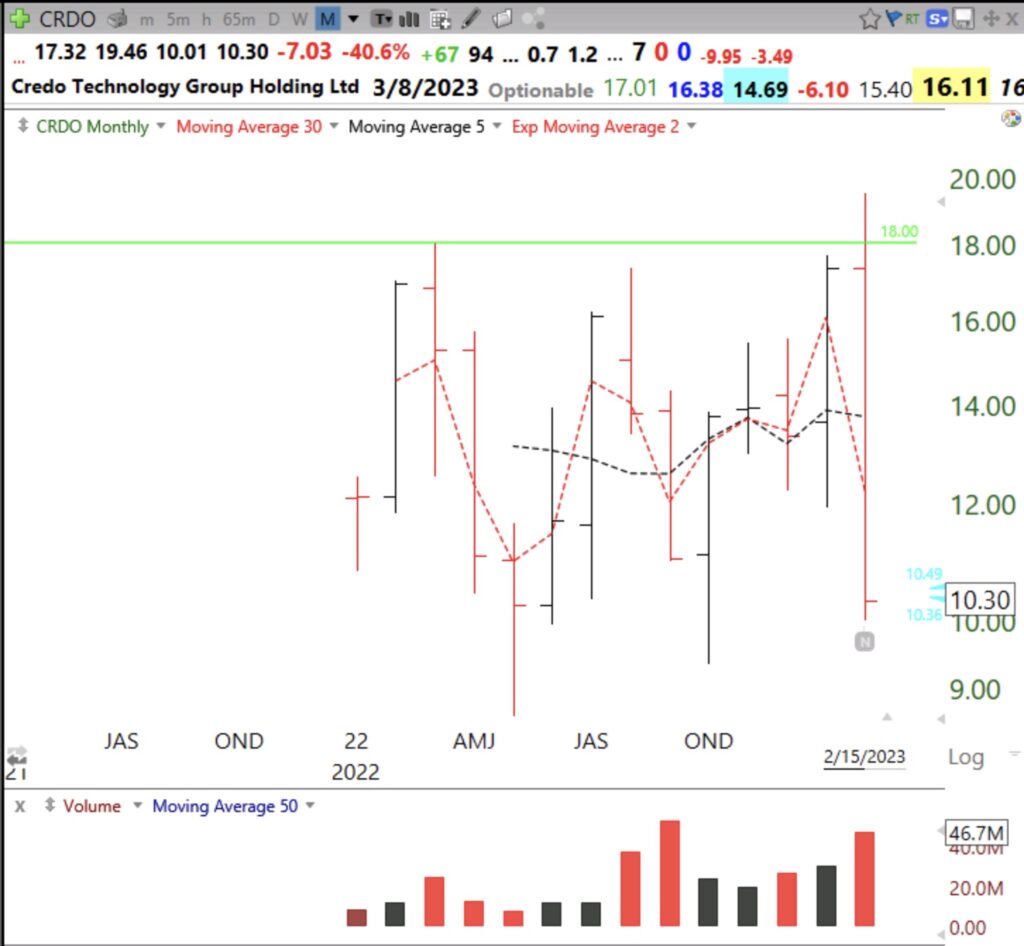
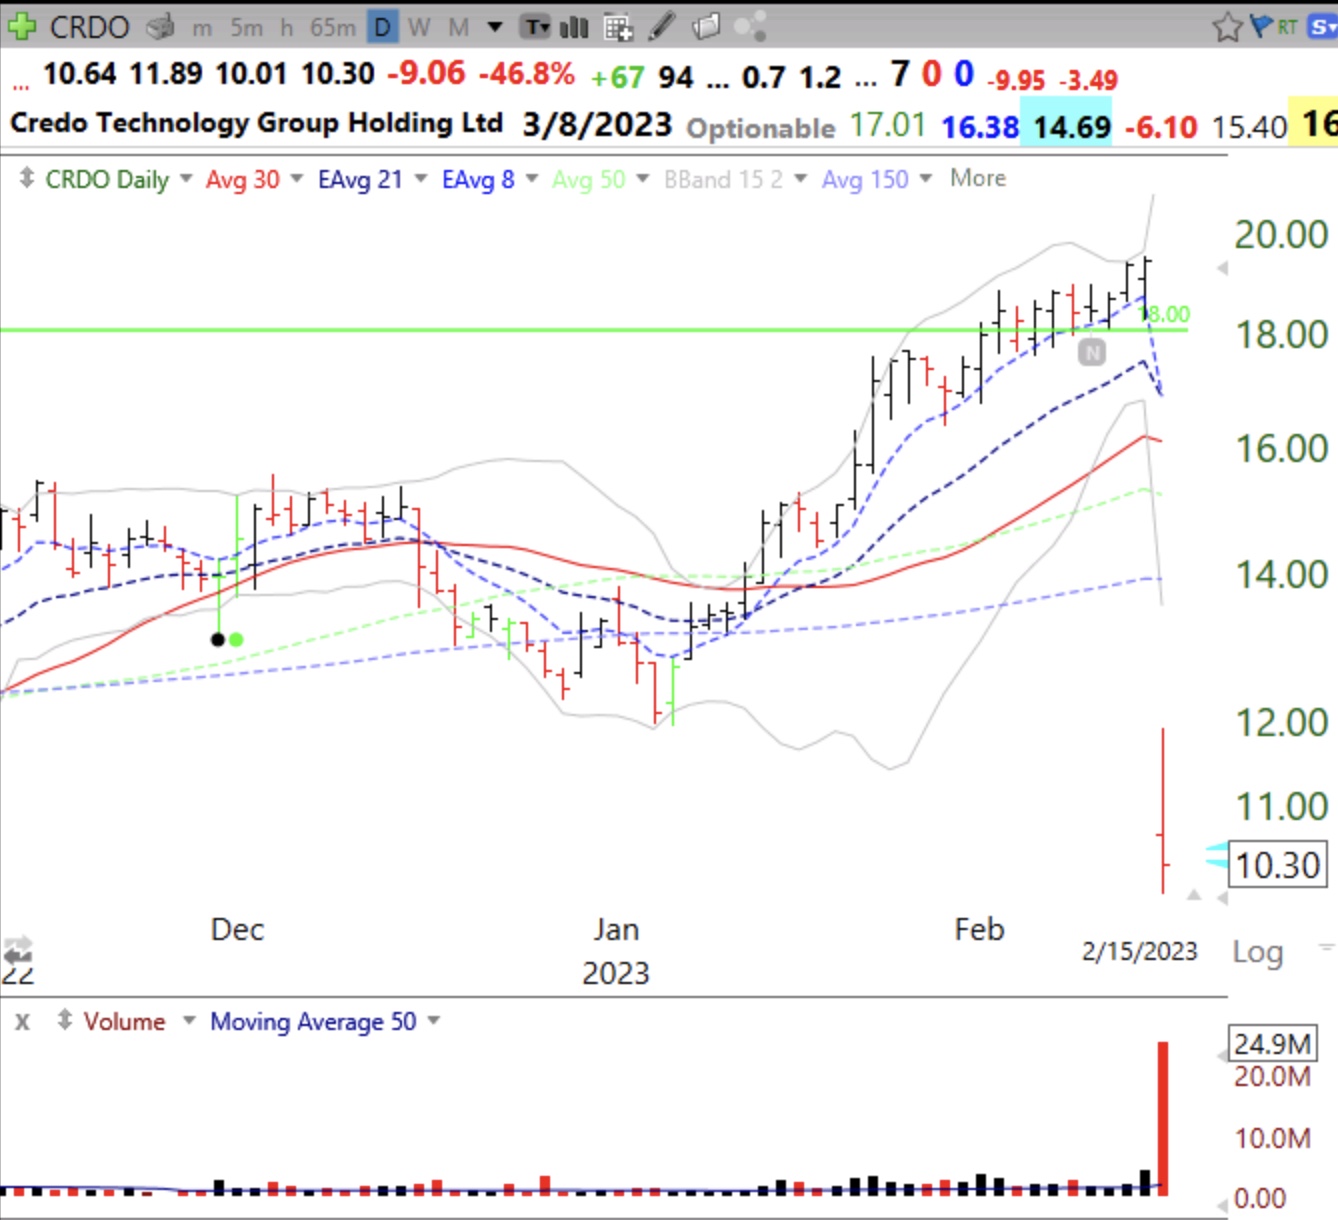
On February 7, I tweeted that CRDO had had a GLB (green line break-out to an all-time high). The green line was at $18.00. In the 7 days after the GLB CRDO went sideways and then started moving up and reached $19.46 on Tuesday, see chart. CRDO then collapsed Tuesday evening when the company announced that a major customer was reducing its purchases and the company reduced future guidance. CRDO opened Wednesday at $10.64 and closed at $10.30, down 46.8%. The highest it traded on Wednesday was $11.89. Social media was abuzz with people who had been harmed by this steep decline. I too had a very small position and sold out Wednesday morning with a small loss.
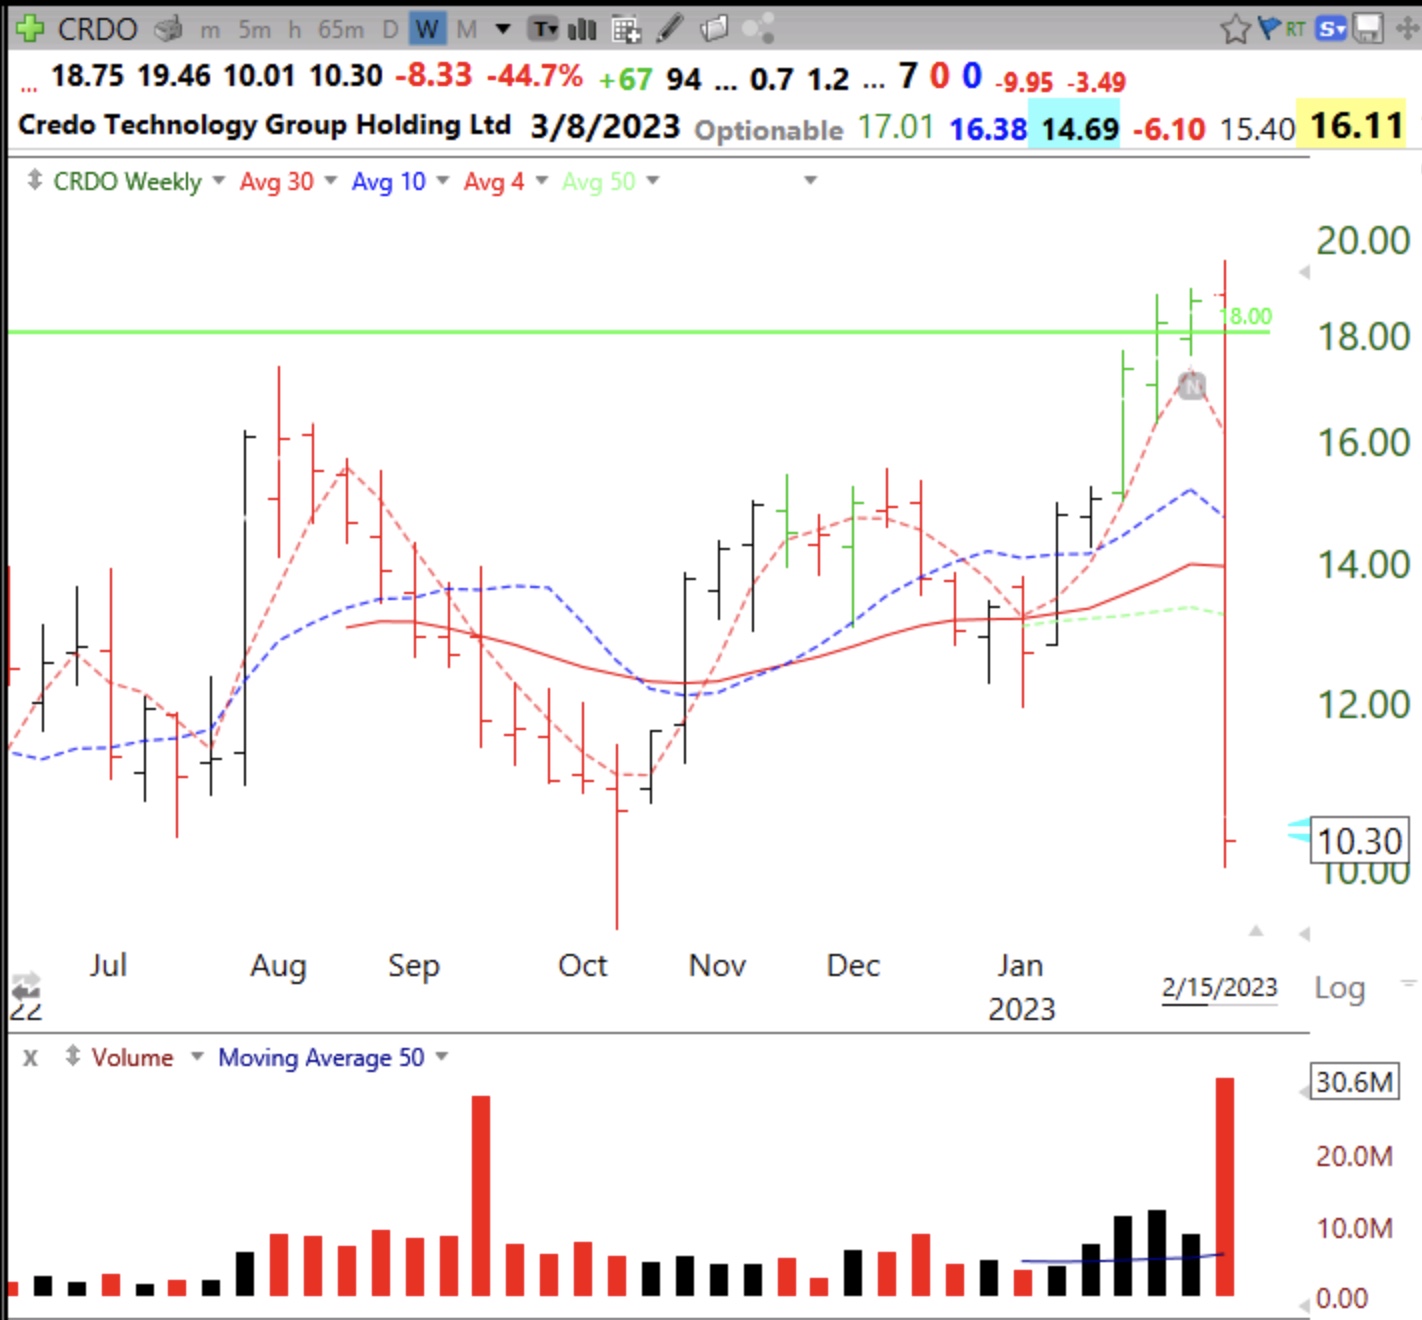
As the great Jesse Livermore would say, the market had exacted some “tuition” from me and I felt it important to learn something after paying it. I went back and looked at the technicals and could find no warning, even in hindsight, that I should have seen in advance. At the time of the GLB the stock had already shown strength by doubling, it was a nice IPO break-out pattern, it had shown some higher volume around the GLB, and it had strong fundamentals. On the weekly chart it had a series of weekly green bars in rising volume, another sign of an upward trend. Potential negatives include not substantially higher volume around the break-out and the stock went sideways rather than shooting up after the GLB. CRDO also was far above its last consolidation when it broke-out. None of these negatives would have been important enough to deter me from buying a little CRDO after the GLB.
I had told my stock buddy, Judy, about CRDO’s GLB. She looked up the company and told me she would not touch it. Why? Because it was headquartered in the Cayman Islands and that was suspect to her. How many great companies are situated there? In addition, after the debacle, I looked at several credible financial sites that said CRDO was headquartered in California. If I had researched the company more before buying and seen this discrepancy, maybe I would have not ventured in, but I doubt it.
When I buy a GLB I promise to sell if the stock closes back below the green line. I often use a mental stop, if I can monitor it, so I will not be sold out automatically if it trades below the green line intraday but closes back above it. EVEN IF I HAD A HARD SELL STOP IN, IT WOULD NOT HAVE PROTECTED ME. I WOULD HAVE BEEN SOLD OUT AT WEDNESDAY’S OPEN, AROUND $10.64! STOPS DO NOT PROVIDE 100% PROTECTION.
So what did I learn? Perhaps to investigate a company more before I pull the trigger. But more likely, not to buy a very large position at a break-out. Much better to average up once a stock proves itself and the volume confirms. But what CRDO did, suddenly revealing bad news after the market closed, is possible with any company. So it is important to not concentrate too much in a single stock and to even buy insurance with put options to protect a large gain. I also think that such debacles may be much less likely with larger companies that have more of a track record, and are not situated on an island.
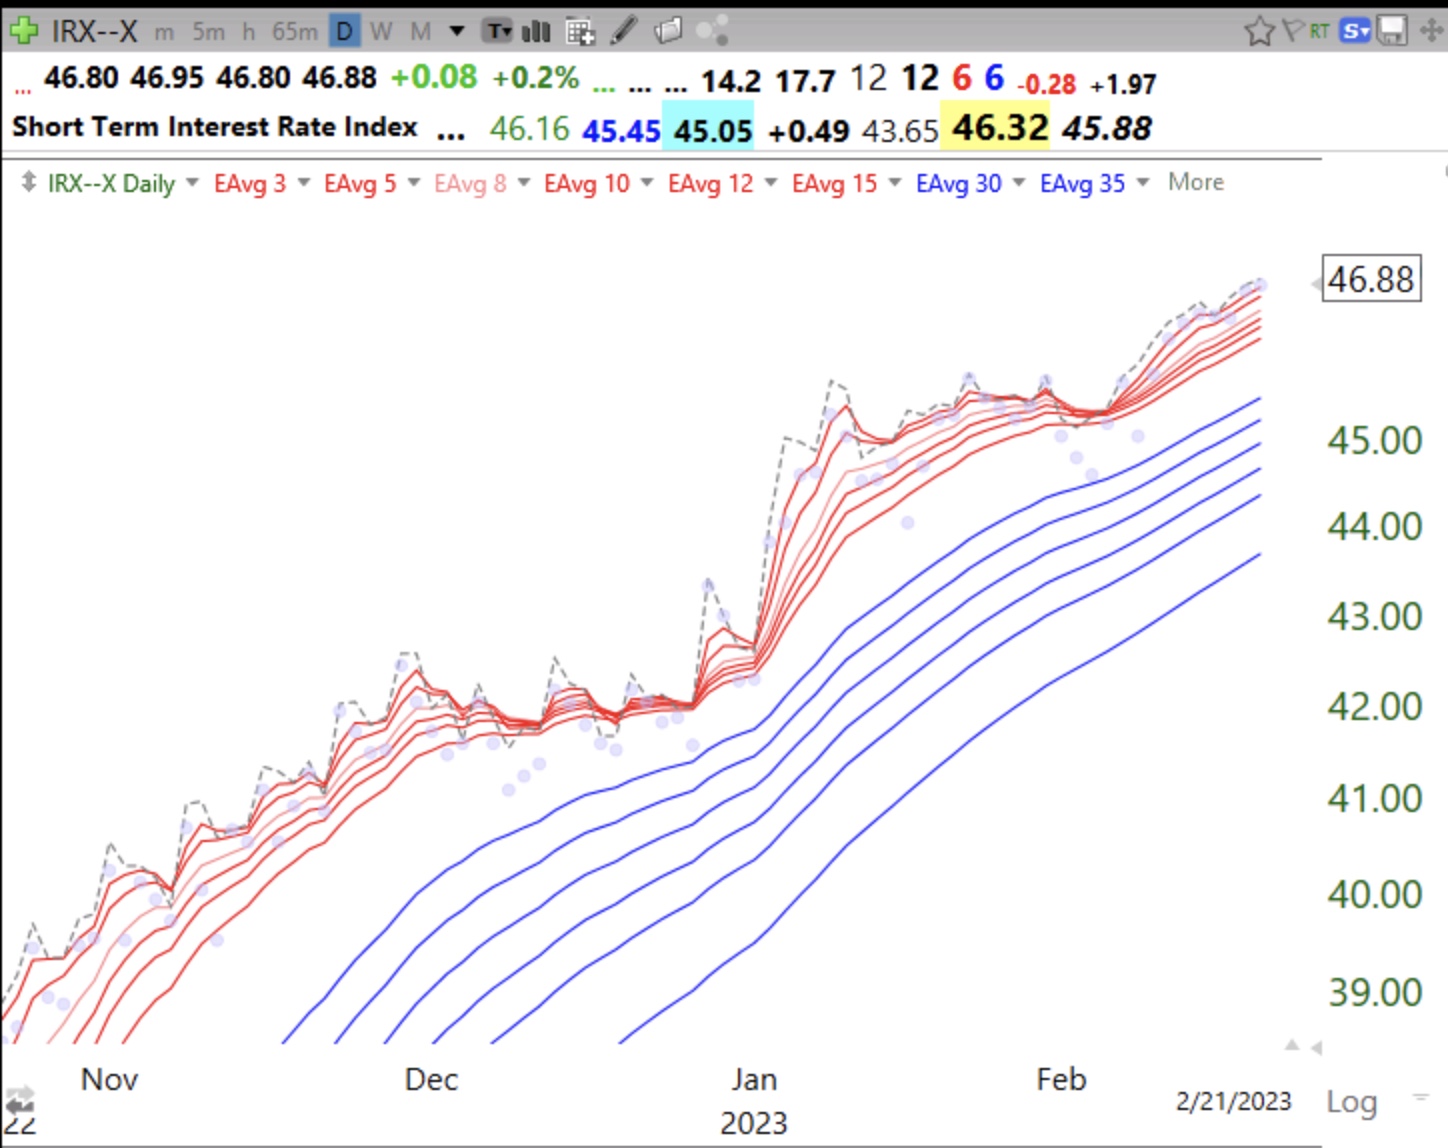
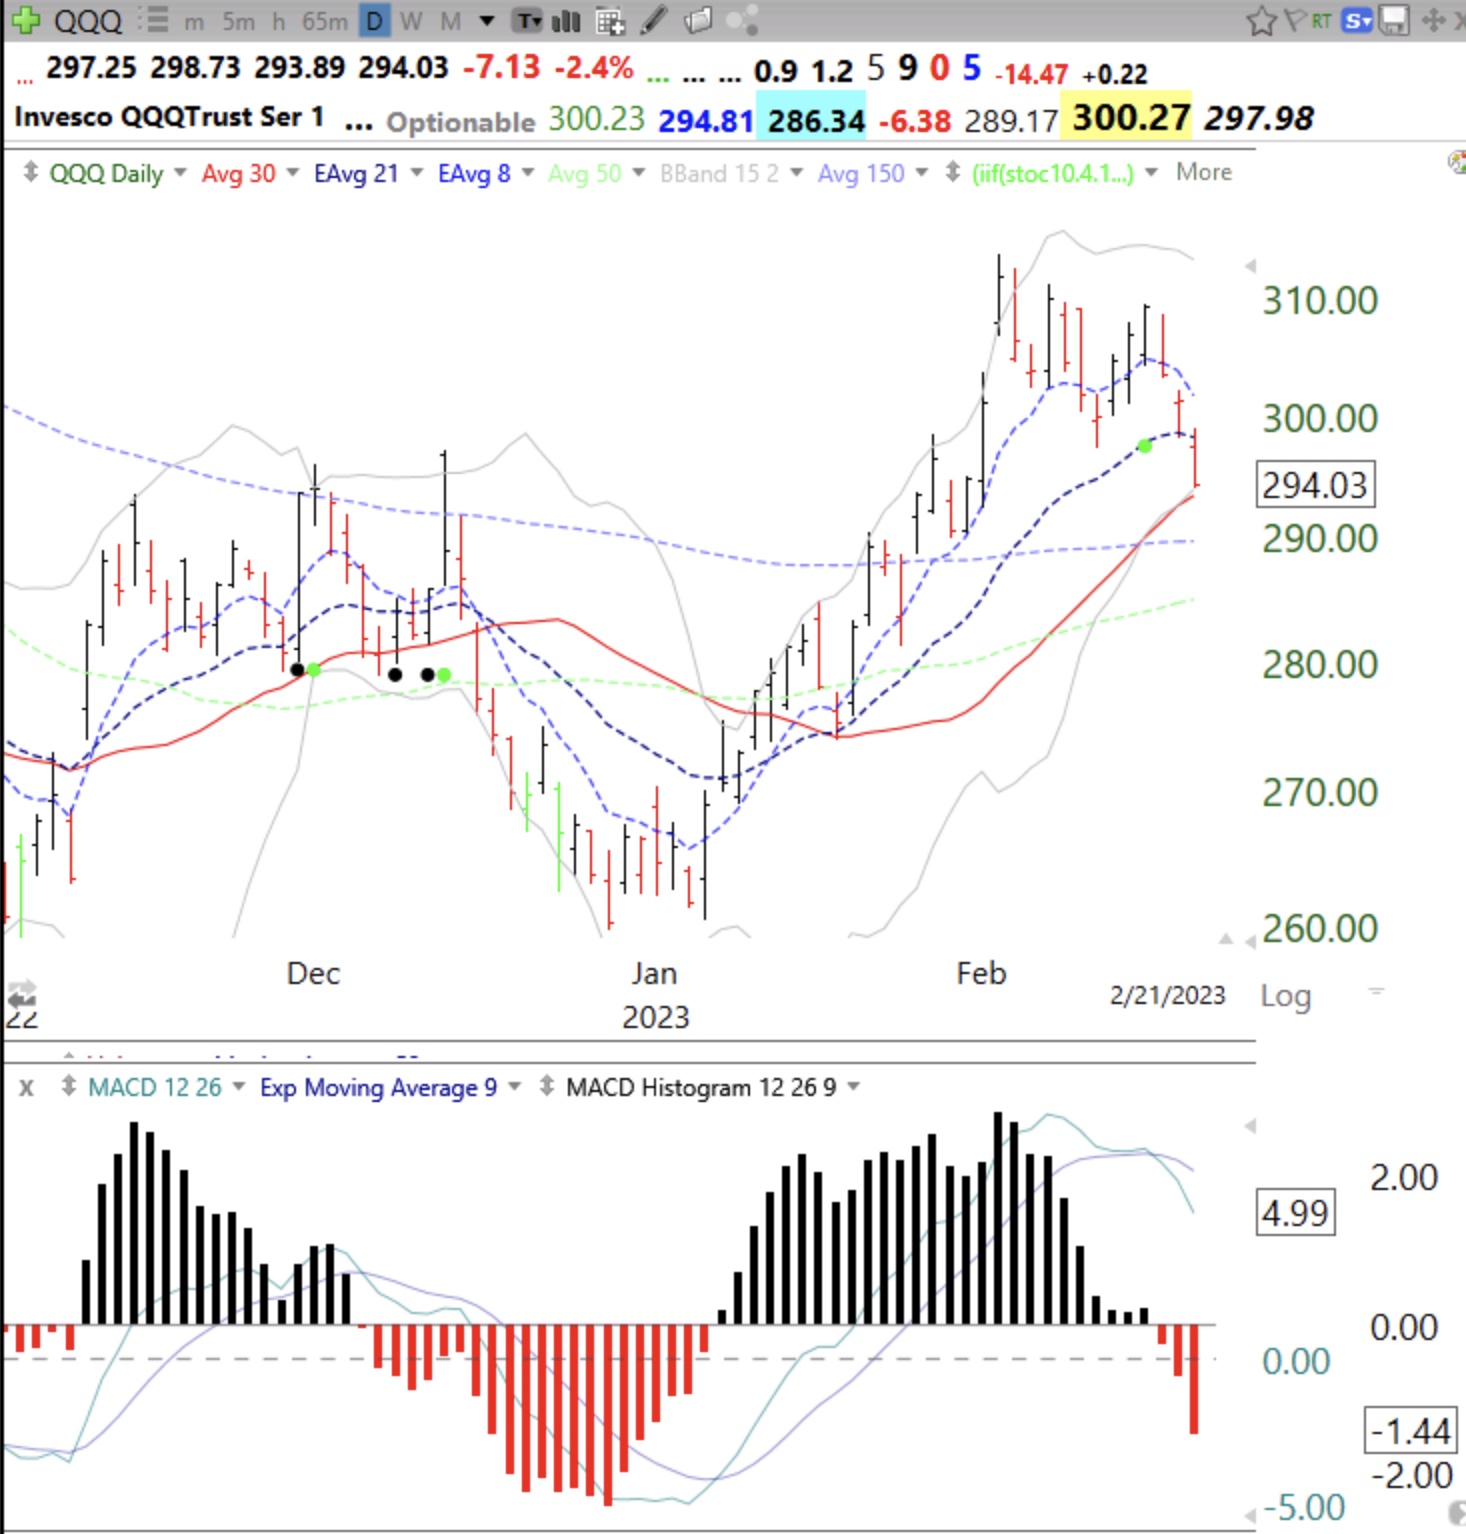
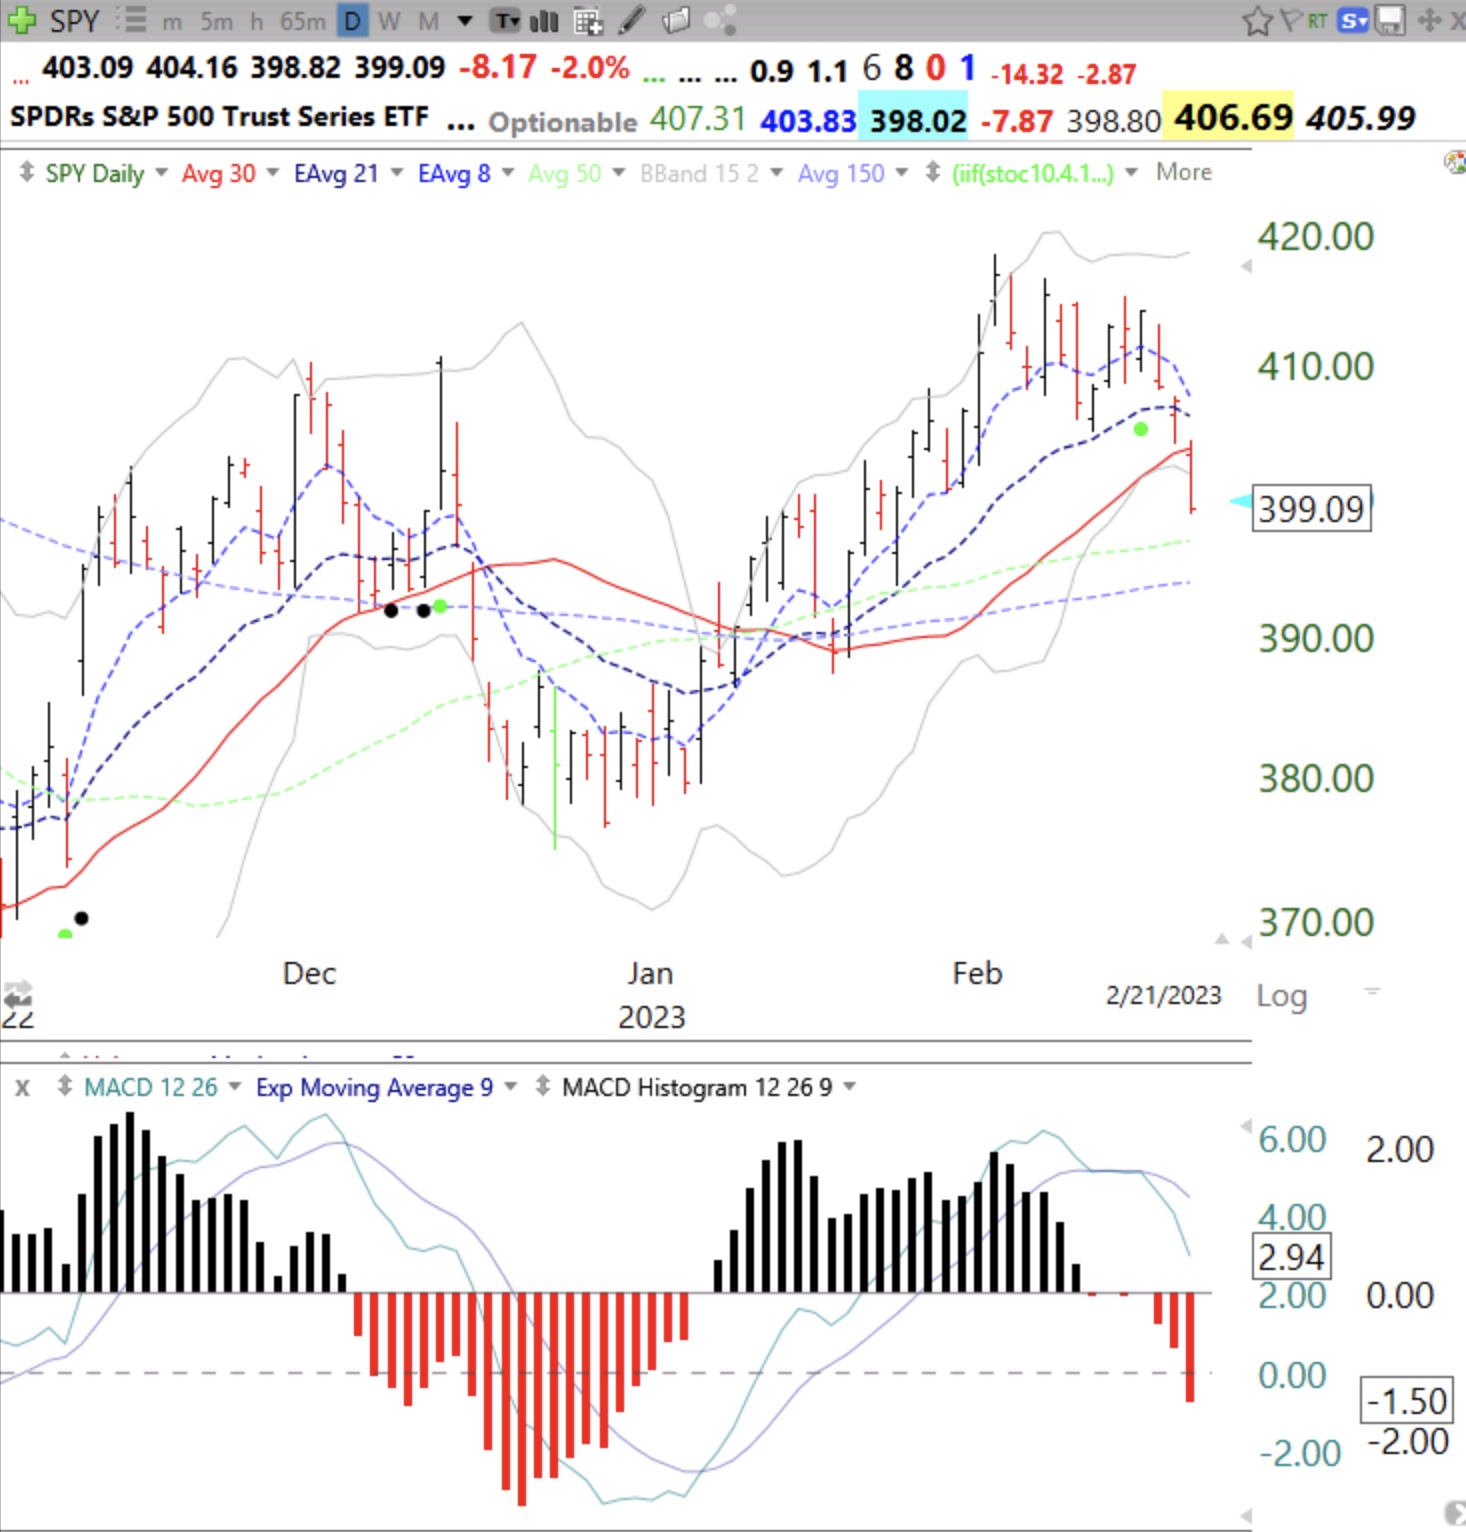
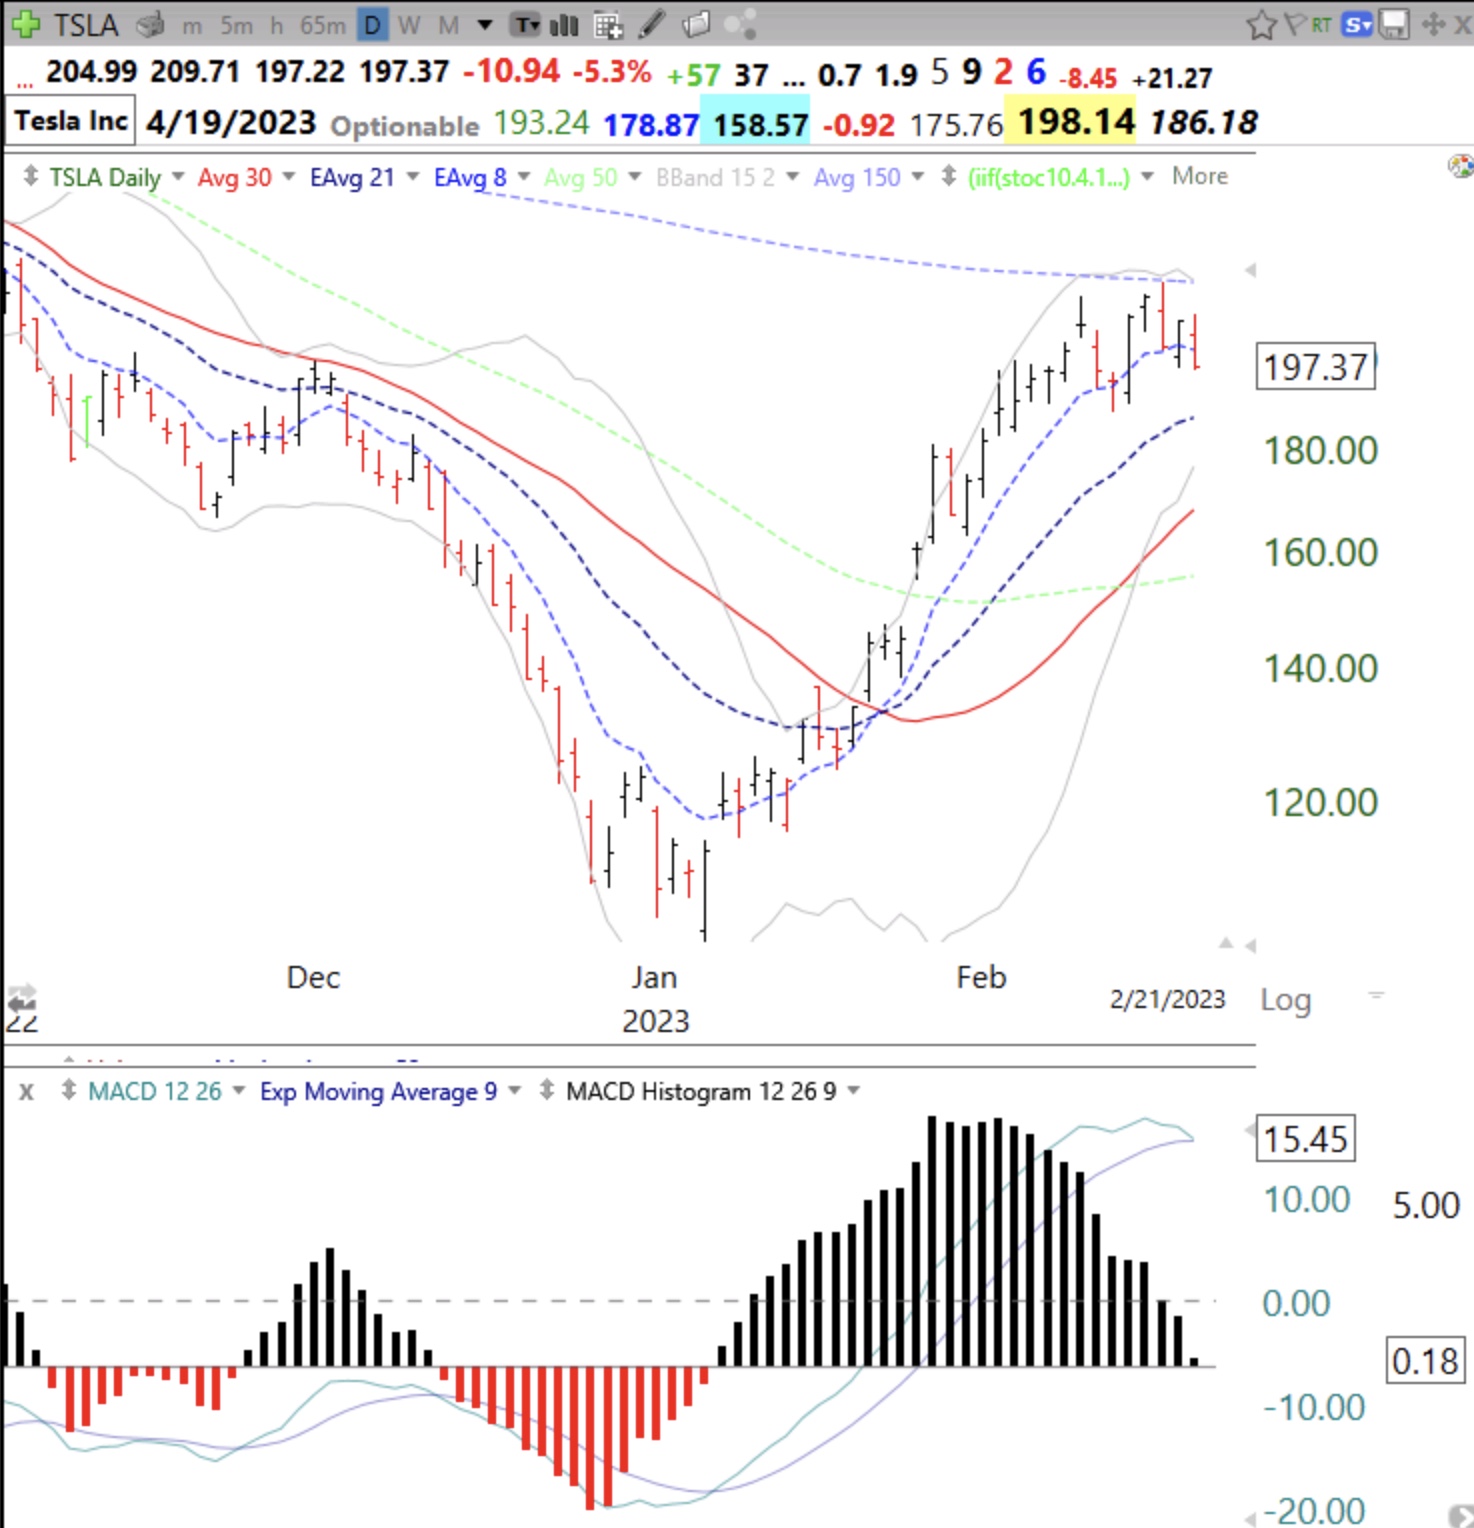
Here are the daily, weekly and monthly charts from which to study and learn.