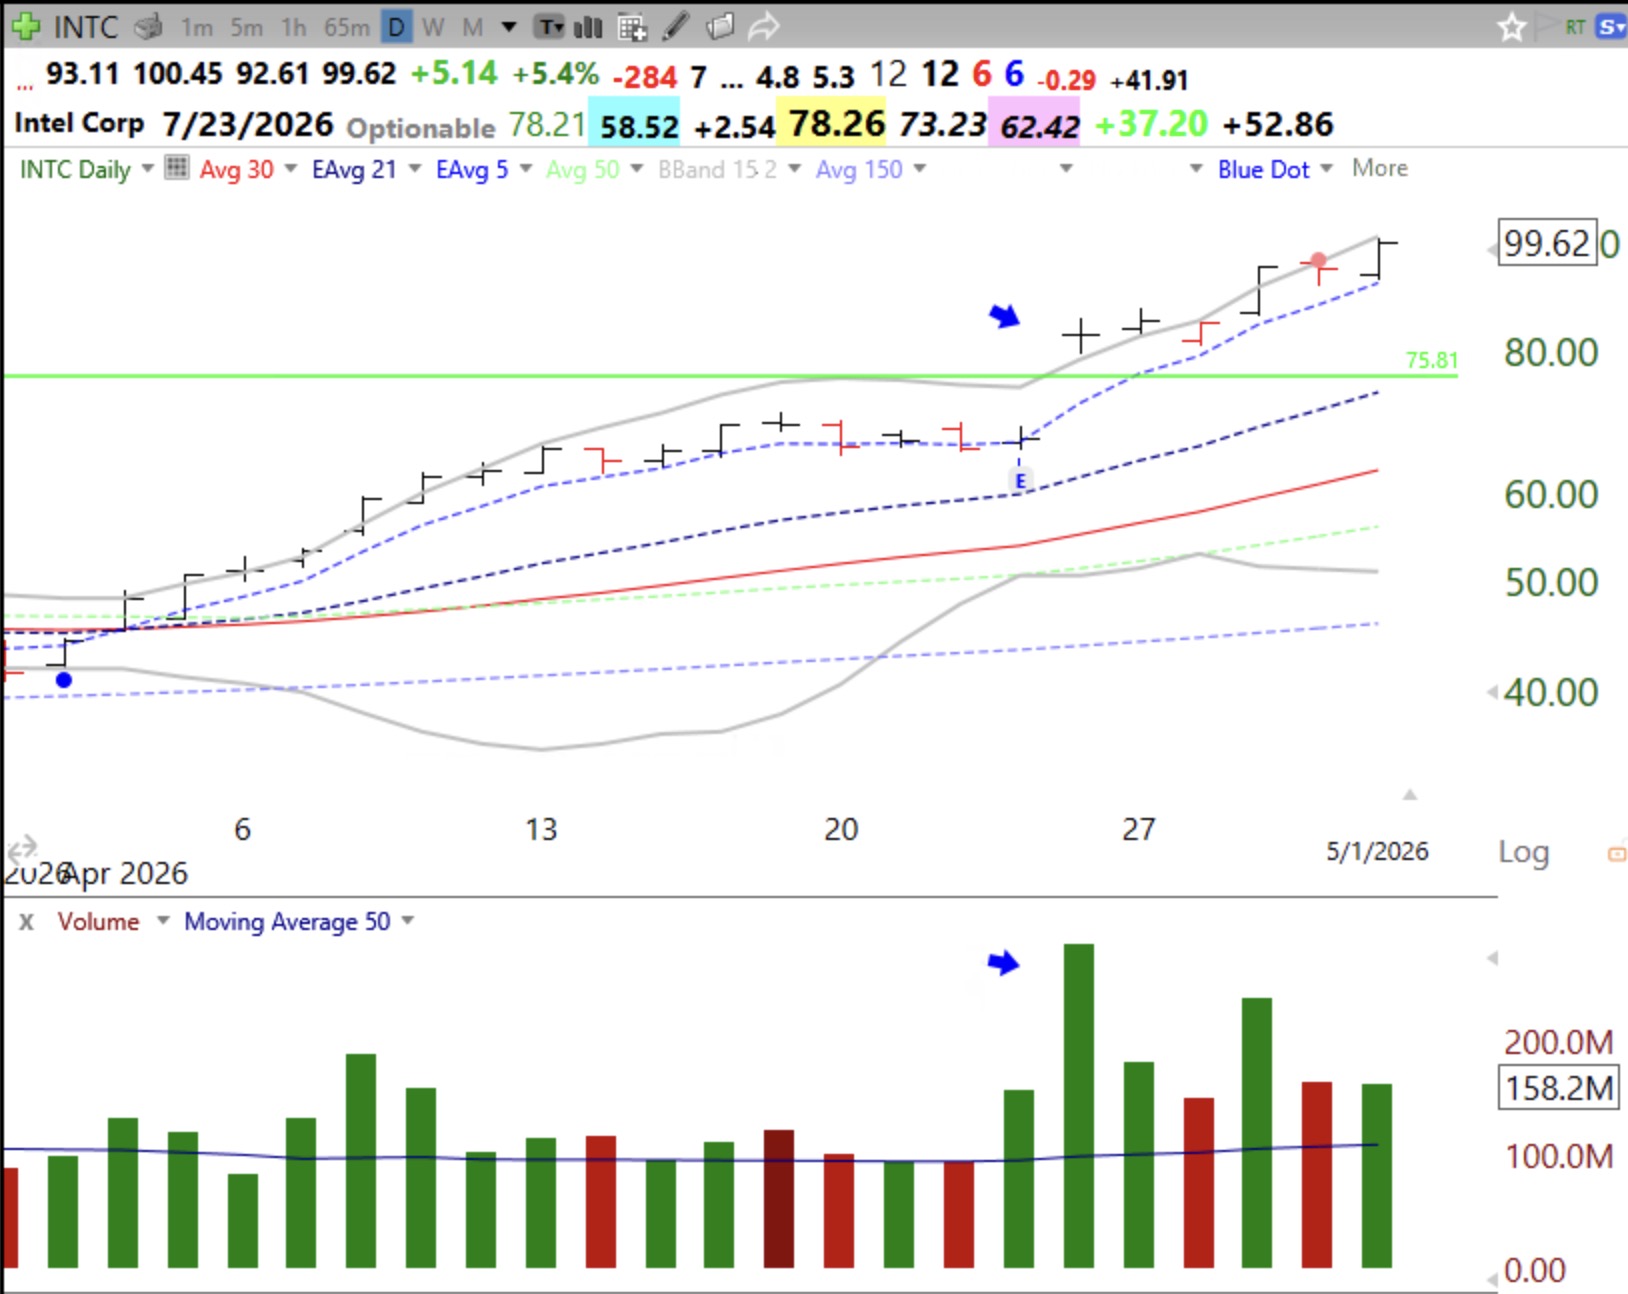
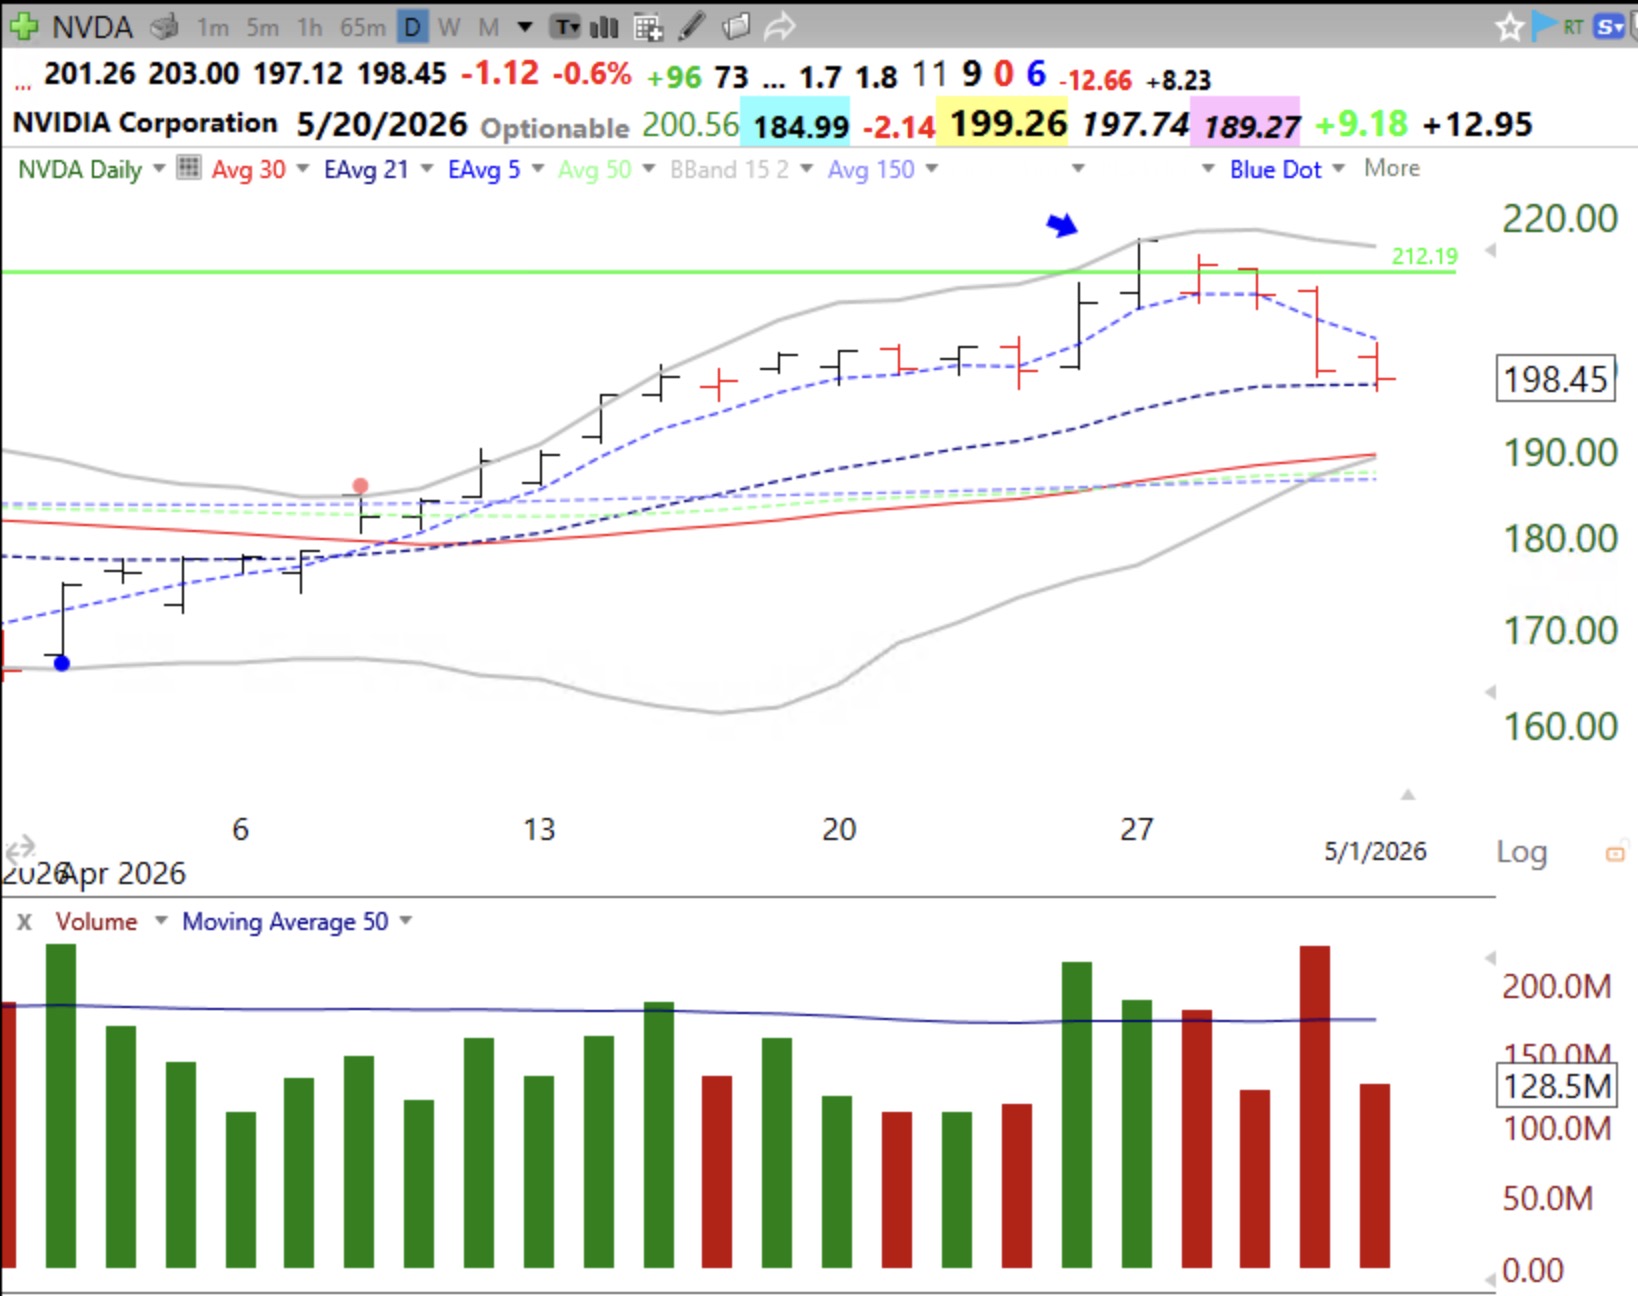
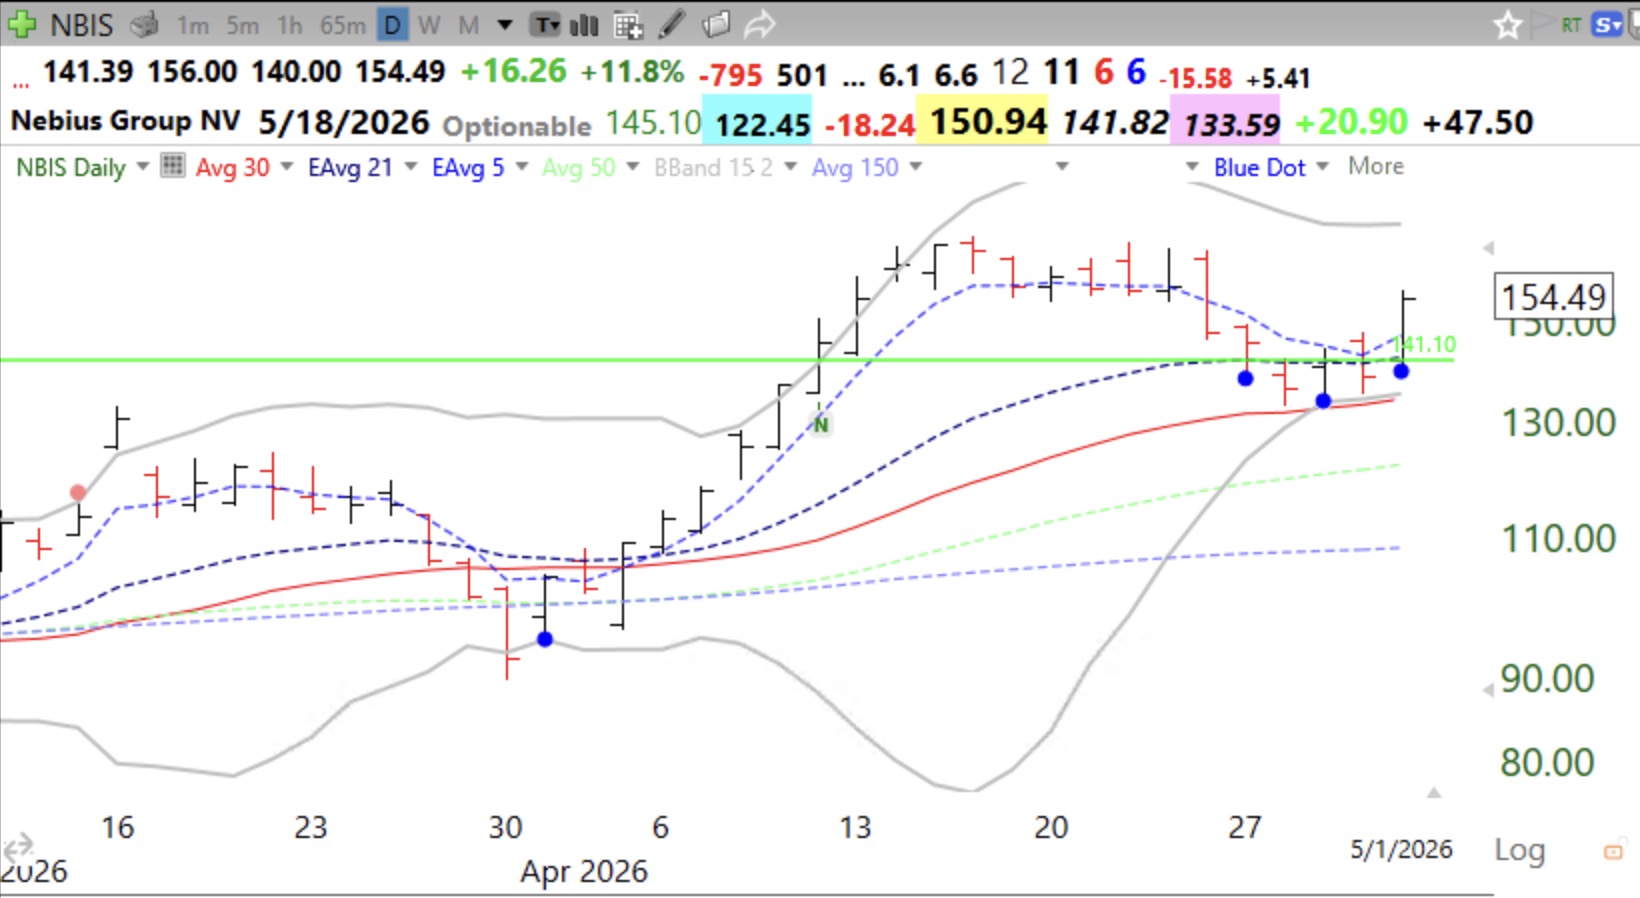
INTC looks strong thus far after its post earnings release high volume GLB, but NVDA has had a failed GLB. Let’s see if NVDA can retake its green line @212.19 when it reports earnings on 5/20. Also watching NBIS after it has retaken its green line, see daily chart.
NVDA may find support near its lower Bollinger Band and 30 day average around 188-189.
NBIS has retaken its green line after three blue dots (oversold bounces). I am watching it closely. I explained the Blue Dot of Happiness setup in my TraderLion 2025 presentation, the link is on the Webinars tab to this blog.
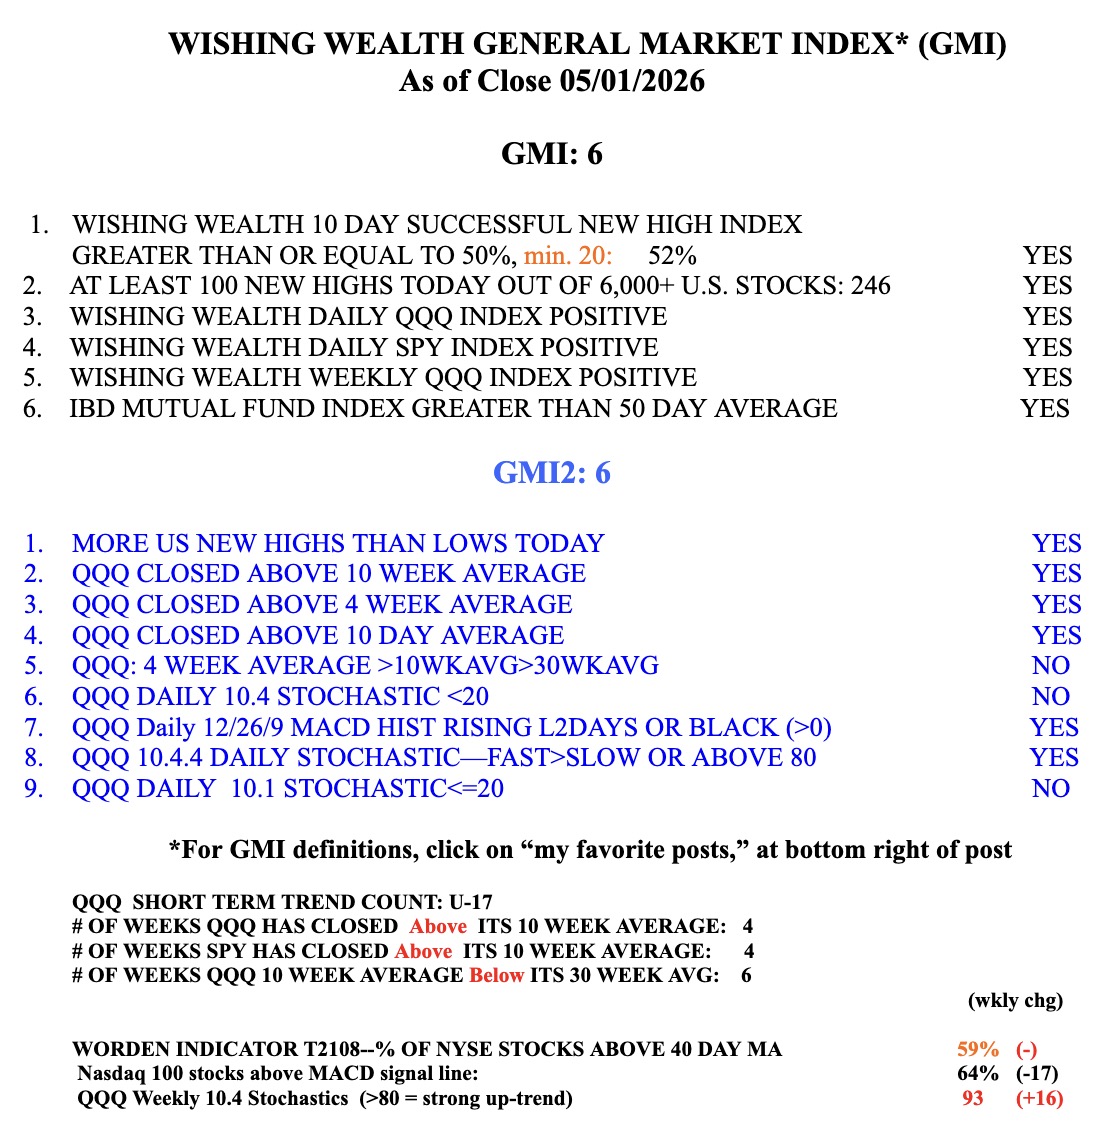
GMI remains at 6 (of 6) and on a GREEN signal.