Skip to content

Wishing Wealth Blog

Stock Market Technical Indicators & Analysis

  • Home
  • About
    • Disclaimer
    • Contact
  • Recommended Reading
  • Topics
    • General Market Index (GMI) table
    • Nicolas Darvas
    • My Favorite Posts
    • Tutorial
    • UMDSMC Education Posts
    • Video blog
  • Webinars
    • TraderLion 25 Annual Conference
    • 2025-07-17 Long Island Traders Meetup
    • Boston IBD Meetup, May 21, 2025
    • 01/2024 NoVA IBD Meetup
    • AAII
      • Eastern Michigan – 01/2022
      • Research Triangle – 12/2021
    • 2021 TraderLion Presentation
    • 2022 TraderLion Webinar
    • TC2000 User Group – December 2012
    • 2012 Houston TC2000 Webinar
    • Doctor’s Orders – August 2010
    • A Word from Dr. Wish – April 2010
    • Other Dr. Wish Videos…
  • Glossary
  • $25 Coupon for TC2000

Dr. Wish

15th day of $QQQ short term up-trend; Beware of $TSLA and $SNDK

Wednesday, February 25, 2015 @ 10:00 pm by Dr. Wish
GMI6/6
GMI-28/9
T210865%

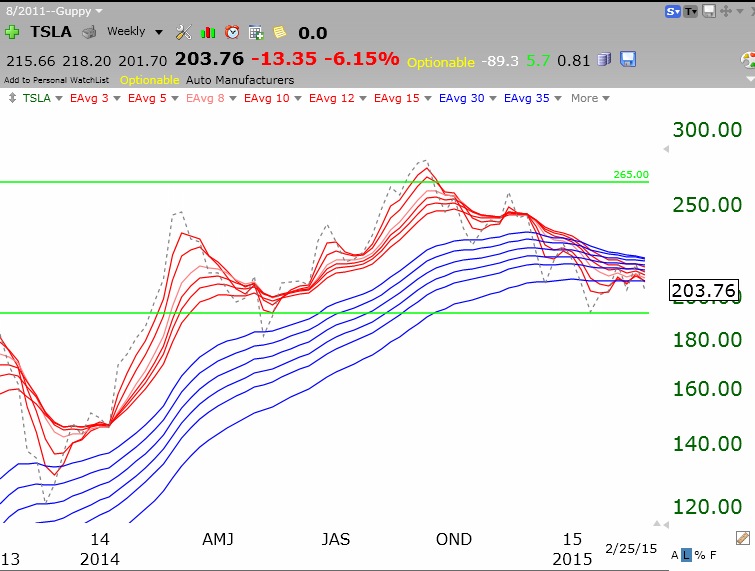
TSLA has a troubling GMMA chart.
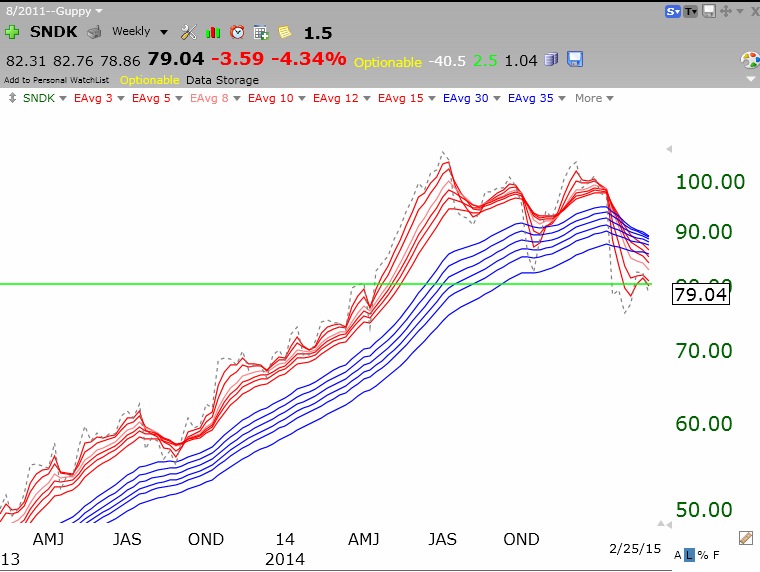
TSLAGMMA02252015As does SNDK:

SNDKGMMA02252015

1 Comment

14th day of $QQQ short term up-trend; 12 promising stocks at new highs

Tuesday, February 24, 2015 @ 10:21 pm by Dr. Wish
GMI6/6
GMI-28/9
T210864%

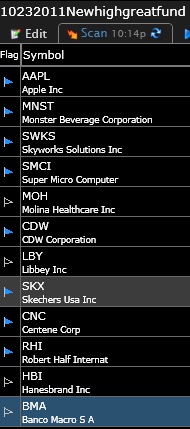
Twelve stocks came up in my new high and great fundamentals scan.   All of these stocks have RWB rocket patterns and are worth researching.   All but BMA are at all-time highs. I own two of them.

Highfund02242015


1 Comment

13th day of $QQQ short term up-trend; $AAPL, $SWKS–RWB stocks

Monday, February 23, 2015Monday, February 23, 2015 @ 10:25 pm by Dr. Wish
GMI6/6
GMI-28/9
T210864%

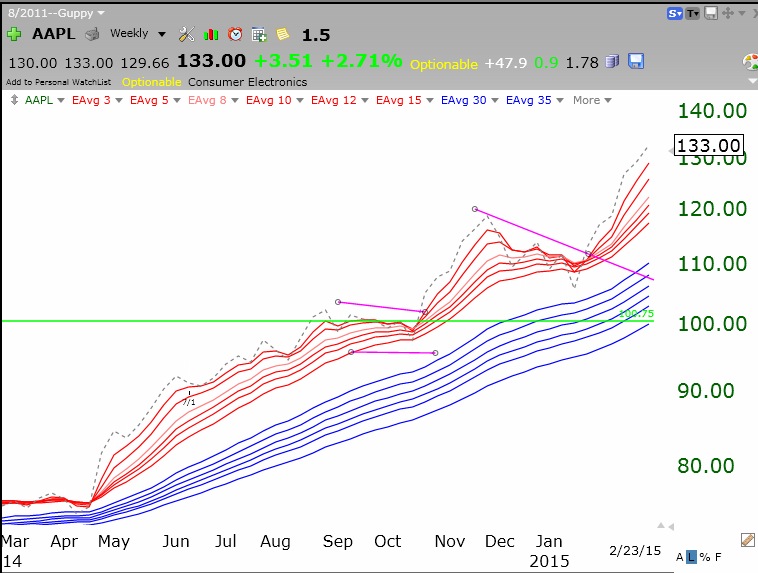
AAPL remains in an RWB rocket pattern.

AAPLGMMA02232015As does its supplier, SWKS.

SWKSGMMA02232015

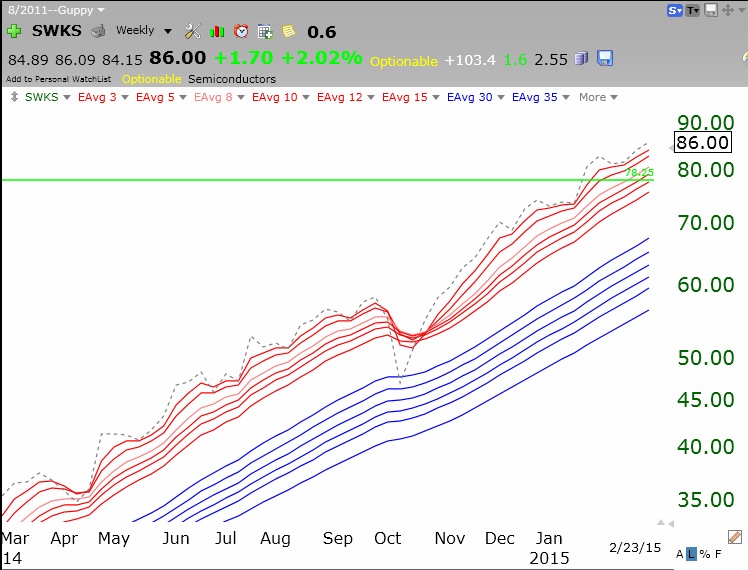
Both are above their green line, all-time peaks.

Leave a comment
Older posts
Newer posts
← Previous Page1 … Page821 Page822 Page823 Page824 Page825 Page826 Page827 … Page1,544 Next →

Current GMI Signal

RED

since close on Mar 6, 2026

Successful GLBTracker

Selected stocks that have had a successful recent Green Line Breakout (GLB). One can really profit by buying stocks breaking out to all-time highs after a consolidation of 3 months or more, my GLB Setup.

Sym.DateGLB $Now $Chg.
HWM11/14/23$51.34$239.04365.60%
SFM1/29/24$49.45$75.8653.41%
CRS4/23/24$79.66$404.32407.56%
AGX9/6/24$76.70$571.38644.95%
BKNG9/16/24$3,918.00$4,184.566.80%
APP9/17/24$116.09$387.84234.09%
EAT10/1/24$78.33$143.3583.01%
PLTR11/5/24$44.91$146.49226.19%
SPOT11/6/24$387.44$470.0121.31%
CRWD4/24/25$398.33$393.31-1.26%
CLS5/1/25$87.00$288.73231.87%
RGC5/1/25$1.55$33.722075.48%
CCJ6/9/25$62.55$111.1377.67%
CRWV5/14/25$64.62$78.4421.39%
GEV5/20/25$447.50$894.7899.95%
NVDA6/3/25$140.76$175.7524.86%
MIRM8/7/2025$54.23$94.6274.48%
CCJ6/9/25$62.55$111.1377.67%
QBTS5/20/25$13.23$13.703.55%
SNDK9/4/25$58.36$692.731086.99%
IREN9/9/2025$28.25$34.0920.67%

Indicators in your Inbox

Get new posts by email:
PopularMost DiscussedRecent
  • About the General Market Index (GMI)
  • Welcome to the new *and improved* Wishing Wealth
  • How to use IBD 100 and New America stocks and TC2007 to find potential rocket stocks; Market rally begins
  • The new 3x ETF’s–triple your pleasure — or pain
  • 6th day of $QQQ short term down-trend; GMI could signal a Buy
  • In the hospital. Will resume posting next week. Thank you for your patience.
  • How I use put options as investment insurance
  • My first YouTube Vlog (video blog) Post: Sell in May and Go Away?
  • So, Wishing Wealth Reader, Tell Us About Yourself…
  • Blog post: David, my co-presenter, brilliant colleague of 20+ years died in a freak accident on 2/18; Day 35 of $QQQ short term down-trend; 15 promising stocks to monitor
  • Blog post: Day 40 of $QQQ short term down-trend; Daily modified Guppy chart told you to get out of $RH long before Wednesday’s 19% drop. All major indexes remain in BWR down-trends. See $USO RWB up-trend.
  • Blog post: Day 39 of $QQQ short term down-trend; GMI=0; $QQQ weekly chart below shows continuing significant down-trend with 4wk avg<10wk avg<30wk avg; waiting for a confirmed new up-trend.
  • Blog Post: Day 37 of $QQQ short term down-trend; GMI=1 and 10 week average closes week below 30 week average, see weekly chart. Stage 4 down-trend likely.
  • Blog Post: Day 36 of $QQQ short term down-trend; Indexes are very oversold; QQQ topped out in October, 2025, long before the current war, see weekly chart. End of the war may not change the longer term trend. Modified daily Guppy chart would have had you exit META long before Thursday’s debacle, see chart.
  • Blg Post: Day 33 of $QQQ short term down-trend; $QQQ’s 10 week average has crossed below its 30 week average, see weekly chart. Beware this likely ominous change in the longer term trend.

Blogroll

  • Barchart All-Time Highs
  • Blue Collar Investor
  • CNNMoney: Pre-market Futures
  • Dark Liquidity
  • Seeking Alpha
  • Stock Chartist

Recommended Reading

QQQ and TQQQ ETF Profit Machine Momentum Masters - A Roundtable Interview with Super Traders - Minervini, Ryan, Zanger & Ritchie II Alan Ellman's Selling Cash-Secured Puts: Investing to Generate Monthly Cash Flow Stock Investing For Students - a plan to get rich slowly and retire young Trade Like a Stock Market Wizard: How to Achieve Super Performance in Stocks in Any Market Exit Strategies for Covered Call Writing: Making the Most Money When Selling Stock Options Complete Encyclopedia for Covered Call Writing Wall Street The Other Las Vegas How to Make Money in Stocks: A Winning System in Good Times and Bad, Fourth Edition Trend Trading: A seven step approach to success How Legendary Traders Made Millions: Profiting From the Investment Strategies of the Gretest Traders of All time The Complete TurtleTrader: The Legend, the Lessons, the Results How to Make Money Selling Stocks Short Reminiscences of a Stock Operator Stan Weinstein's Secrets For Profiting in Bull and Bear Markets Lessons from the Greatest Stock Traders of All Time How I Made $2,000,000 In The Stock Market

Archives

© 2026 WishingWealthBlog.com
 

Loading Comments...