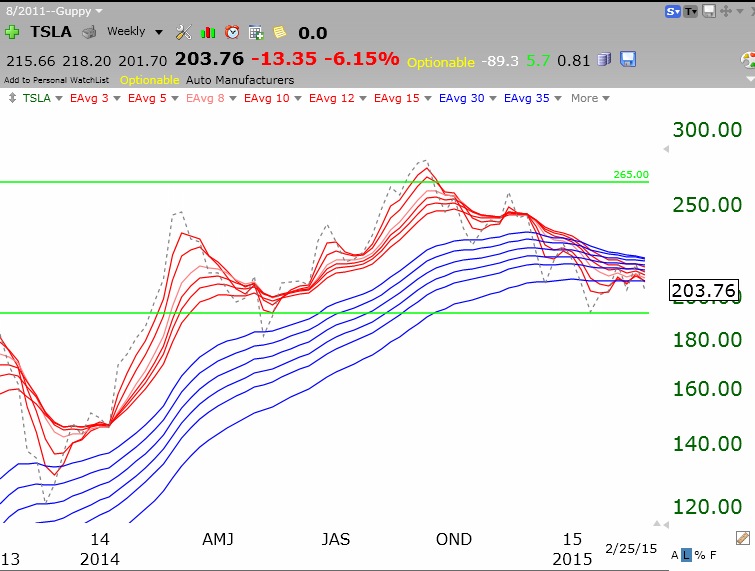
15th day of $QQQ short term up-trend; Beware of $TSLA and $SNDK Wednesday, February 25, 2015 @ 10:00 pm by Dr. Wish GMI6/6 GMI-28/9 T210865% TSLA has a troubling GMMA chart. As does SNDK: Share this: Email a link to a friend (Opens in new window) Email Share on Facebook (Opens in new window) Facebook Share on X (Opens in new window) X Share on LinkedIn (Opens in new window) LinkedIn Print (Opens in new window) Print More Share on Pinterest (Opens in new window) Pinterest Share on Tumblr (Opens in new window) Tumblr Share on Reddit (Opens in new window) Reddit Share on Telegram (Opens in new window) Telegram Share on WhatsApp (Opens in new window) WhatsApp Related
again out of curiosity… TSLA, from 10/14/2011 (when there is enough data for the long EMAs): RWB*: Profit 495%, MaxDD 36% (buy when short EMA above all long EMA, sell when short below all long) RWB**: Profit 454%, MaxDD 36% (same buy rule, but sell when the short EMAs are under the just the highest long EMA) B&H: Profit 626%, MaxDD 36% For SNDK: RWB*: 254%, MaxDD 84% RWB**: 242%, MaxDD 83% B&H: Profit 1755%, MaxDD 93% Loading...
 As does SNDK:
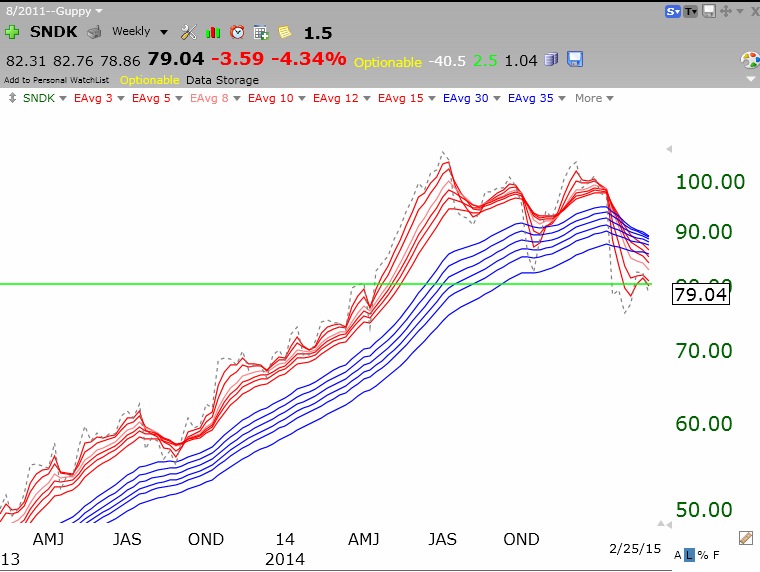
again out of curiosity…
TSLA, from 10/14/2011 (when there is enough data for the long EMAs):
RWB*: Profit 495%, MaxDD 36%
(buy when short EMA above all long EMA, sell when short below all long)
RWB**: Profit 454%, MaxDD 36%
(same buy rule, but sell when the short EMAs are under the just the highest long EMA)
B&H: Profit 626%, MaxDD 36%
For SNDK:
RWB*: 254%, MaxDD 84%
RWB**: 242%, MaxDD 83%
B&H: Profit 1755%, MaxDD 93%