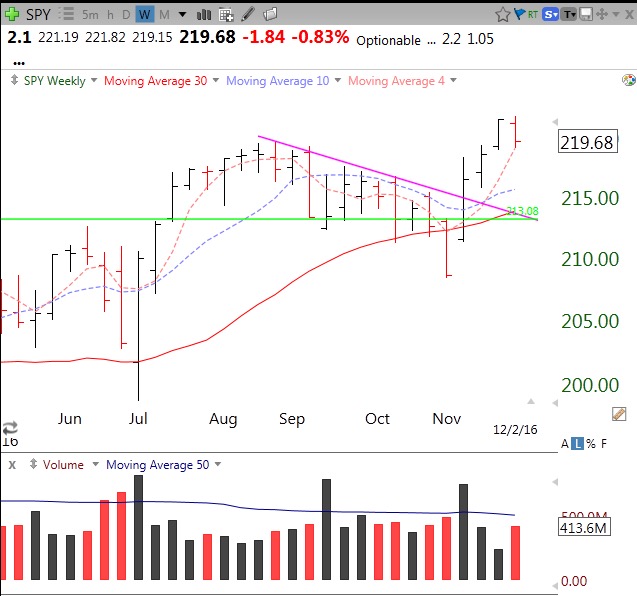
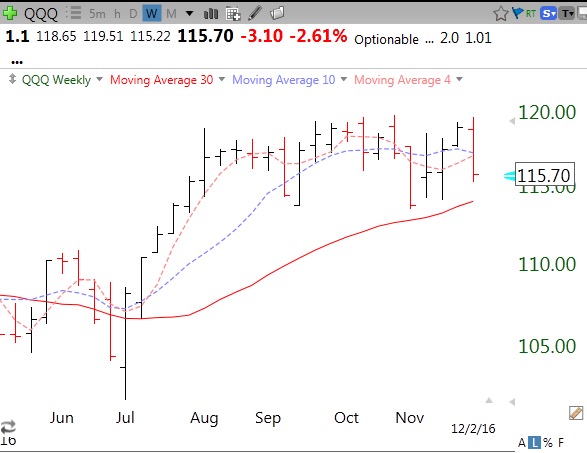
Friday marked the first day of a new QQQ short term down-trend. Note, however, that many (about 40%) QQQ short term down-trends end in under 5 days. Both the QQQ, SPY and DIA remain in longer term Stage II up-trends. The QQQ, however, has now closed back below its 10 week average. These weekly charts of SPY and QQQ show important differences. SPY is climbing its 4 week average (red dotted line) which is above its 10wk (blue dotted) and 30 wk average (red line). SPY broke out of a multi-week counter-trend decline (purple line) 4 weeks ago.
In contrast, the QQQ is now below its 4wk and 10wk averages. I can even see signs of a possible head and shoulders top forming. A close below its 30 week average (near 114) would be a sign of major weakness. The disparity between the SPY, DIA and the QQQ is likely caused by the Trump rally’s focus mainly on the infrastructure and financial stocks, not dominant in the QQQ. Once the euphoria of anticipation under-pinning this rally comes up against the reality of Democratic governing, we could face major market weakness beginning in January. The QQQ will likely rally towards the end of December when mutual funds spruce up their portfolios for end of quarter/year reports to their shareholders. Such a rally may be a great time to exit positions or raise stops….
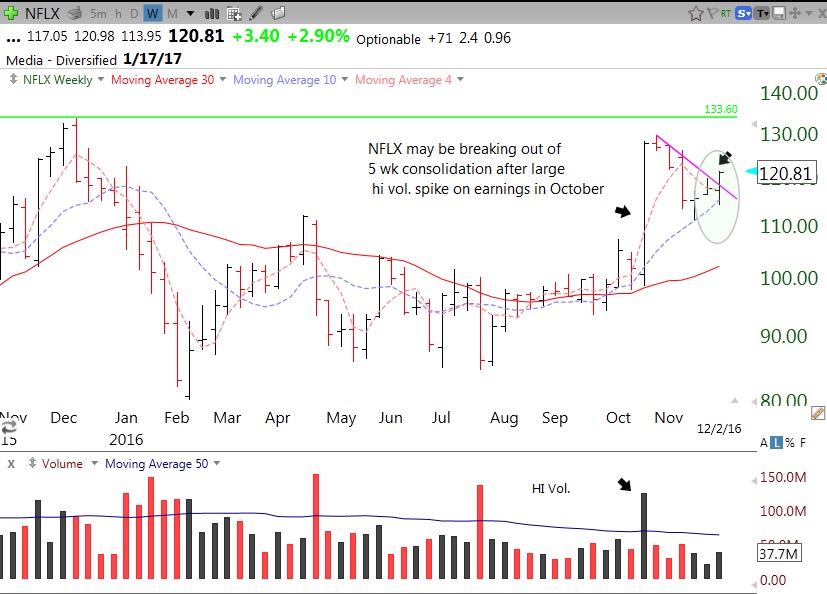
On Friday I tweeted intraday (@wishingwealth) that NFLX looked like it was breaking out of a consolidation, following its huge high volume spike in the third week of October after it released earnings. A close back below the declining trend line (purple), around 115, would indicate to me a possible failure of the break-out and a reason to exit the trade.
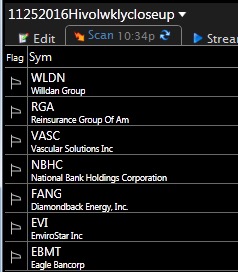
For those of you who signed up last week to access my Club on TC2000, I just published the scan that produced these 7 rocket stocks (all are above their last green line tops) this weekend. These are stocks with recent EPS change of at least + 90% that have advanced a lot this year and rose last week on above average weekly trading volume. See if your scan yields these too. (This scan will only yield stocks towards the end of a week because of its requirement for above average weekly volume.)
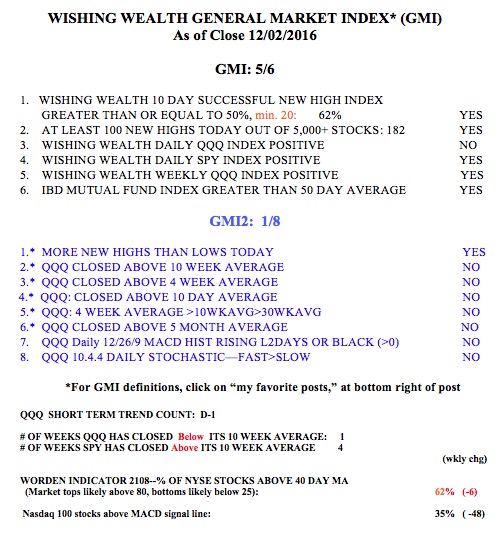
The GMI remains at 5 (of 6). The more sensitive GMI-2 is at 1 (of 8), reflecting the short term weakness in the QQQ. Note the huge decline to only 35% of NASDAQ 100 stocks above their daily 12.26.9 MACD signal lines. Time to be especially vigilant.
The scan didn’t work for me. I didn’t get any results at all.
Caleb, bring up the scan. Click edit and on “List to Scan” where it says “Combo Text” click that drop down box and choose “U.S. Common Stocks”. Scan again now and it will work.