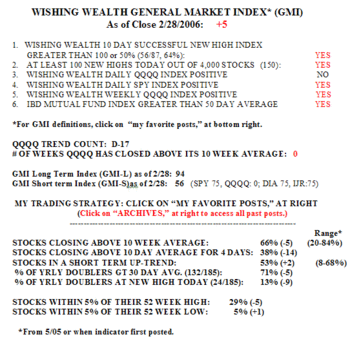
I am posting after the open today, so I will not opine about today’s market. I only want to provide you with Tuesday’s closing stats. The GMI remained steady at +5, but the GMI-S fell to 56. This drop occurred because the Nasdaq 100 short term indicators are all negative and because all of the other indexes closed below their 10 day averages. Closing below the 10 day average is not a sign of huge weakness.  Typically, consecutive closes above the 10 day average occur during sustained rises. A stock or index can close below this average and still be in a sustained rise, just rising at a slower rate. So, the decline in the GMI-S just indicates, for now, a slowing in the rise of these indexes. A return above the 10 day average by these indexes would indicate to me a resumption of a stronger short term up trend . The GMI-L is still at 94, showing that all of these indexes remain in a longer term up trend. On Tuesday, only 21% of the Nasdaq 100 stocks rose, along with 12% of the S&P 500 stocks and 10% of the Dow 30 stocks. There were still 150 new highs in my universe of 4,000 stocks. The percentage of stocks in a short term up trend rose to 53% , but the percentage that closed above their 10 day averages for the past four days declined to 38%, another indication of the slowing of the rises in these stocks……….
I have been buying the gold ETF, GLD, as it appears to have bounced off of its rising 30 day moving average. In the recent past, such bounces have occurred at the beginning of profitable rises. I always place a stop loss below the bounce to protect me against a decline.
Please send your comments to: silentknight@wishingwealthblog.com.