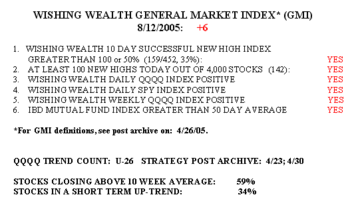
I’m back from vacation—and suffering from jet lag. But I think it is important to update the GMI and the WPM. The GMI has not changed since my last post on 7/29 and remains at +6. However, there are a number of critical signs of weakness in the markets.  While there were 159 successful 10 day new highs on Friday, only 35% of the 452 stocks that hit a new high 10 days earlier closed higher on Friday than 10 days earlier. The 142 new yearly highs in my universe of 4,000 stocks was the least since there were 130 on July 18. The SPY, QQQQ, and growth mutual fun indicators remain positive. However, only 59% of stocks closed above their 10 week averages, down from 79% on 7/29 and the percentage of stocks in a short term up-trend declined from 61% to 34%. Unfortunately, I did not track these indicators the past 2 weeks and cannot estimate the timing of these declines. The QQQQ up trend is in its 26th day. However, this index has closed below its 10 day average for the past 6 trading days. Since this QQQQ rally began on July 8, the index never closed below its 10 day average–until beginning, August 5. This is a sign that the QQQQ rally has weakened.
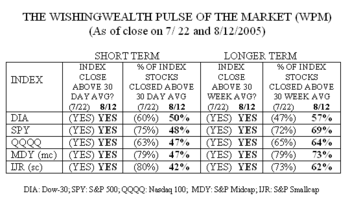
This table of the WPM shows what is going on beneath the indexes.  While the 5 indexes have remained above their critical 30 day and 30 week moving averages, there has been marked short term deterioration within each of the 5 indexes since I first posted the WPM on 7/22. For example, only 48% of the S&P 500 stocks are now above their 30 day averages, down from 75%. In fact, only 42%-50% of the stocks in these 5 indexes closed above their 30 day averages on Friday, compared with 60%-80% on 7/22. There was little change in the percentage of the stocks in these indexes that remained above their longer term 30 week averages, with the exception of the lagging DIA, which strengthened (57% vs. 47%).
Putting it all together, while the longer term up trend seems to be intact, the short term trend has weakened considerably. While it is not necessary that this short term weakness will lead to a change in the longer term trend of the market, remember that the short term moving averages, by definition, will always signal a change in trend before the longer term averages. (The 30 day average changes faster because it measures the last 30 days of trading while the 30 week moving average spans 150 days.)
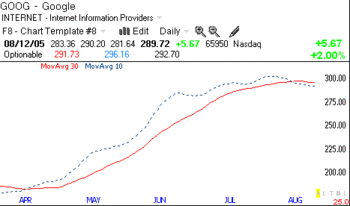
In my previous post, I showed you a "Naked Chart" of GOOG displaying the 10 and 30 day averages without the prices. It was clear that the up trend in a stock (GOOG as an example) was clearly shown by the 10 day average’s being consistently above the 30 day average. Well, over the past 2 weeks many of the leading stocks, including GOOG, have shown a negative cross-over with the 10 day average now being below the 30 day average.  Other stocks showing such bearish cross-overs include: CME, SHLD, HD, GM, DSL, GDW, FRE, MW, SMTS, CKCM, LDG, HANS, XMSR, NKE. These are just stocks that I have been watching or trading–there are many more. When leaders of the market like GOOG, CME, SHLD and HANS all appear to be weakening, it is an omen for the general market worthy of our attention. I have therefore been cutting back on my longs and am buying puts on some of the stocks listed above. Time will tell if this is a temporary hiatus in the bull market, or a case of the bear waking from a completed hibernation. Be careful out there.
It’s nice to be back. Please send me your feedback at: silentknight@wishingwealthblog.com.