In the 1990’s while I was teaching myself to trade in that roaring bull market, I kept a diary of my trades and reactions to the market and current events. I looked it over this weekend and saw this entry from 11/11/1995 and thought you might be amused by it:
This past week I attended a lecture at the Sheraton by William O’Neil, founder of Investor’s Business Daily and one of my heroes. Most of what he said I already knew from reading his book. The most startling thing that I learned was that contrary to his rules about selecting only stocks with high EPS values, he was advising institutional investors to buy the current fad internet stocks like C-Cube and Netscape. I got the distinct impression that he was saying that volume and price action was more important than demonstrated earnings growth. In fact he did say that a dramatic rise in volume could be the most important factor. His lecture sensitized me to the need to always look for the most dynamic and fastest growing companies. Stocks that are growing 100% in price a year or have 99 Relative Strength seems to be his major criterion. I would have liked to ask him whether he consciously breaks his written rule to also require a high EPS before purchase. (Copyright, Dr. Eric Wish trading diary, 11/11/1995)
I have written 200+ pages about my thoughts while I traded my way to a small fortune during the 90’s. The diary shows how difficult it was for me to trade profitably as I reacted to the market and current events. When one looks at a long term chart of the indexes over that period it looks like it was easy to make money. It was not. I wonder if anyone would want to read my trading diary if I chose to publish it………
The focus of my class for undergraduates is to teach them, “in a rising market buy visionary rocket stocks that are breaking to new all-time highs or bouncing off of support.” They have now completed 5 weeks of classes and are ready to start specifying their set-up for purchases during a trading competition of a virtual 100,000 margin portfolio. I am posting this analysis of LMAT to provide them with an indication of a possible set-up.
LMAT came to my attention because it hit an all-time high on 8/30. I looked at a monthly chart using TC2000 and drew in a green line top at the last all-time peak that had not been surpassed for at least 3 months. I then looked at its modified Guppy chart of 13 weekly exponential moving averages (six short term and 12 long term averages plus a one week average that shows its weekly closes).
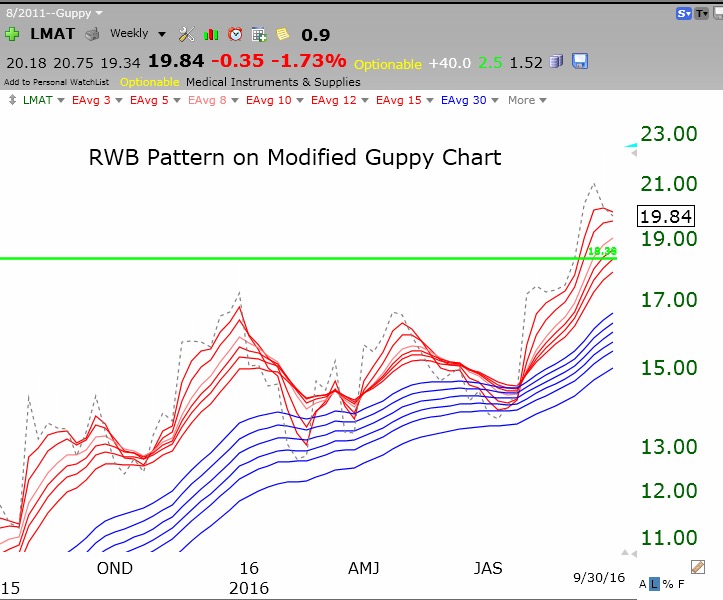 I saw that LMAT had an RWB pattern with all 6 short term averages (red lines) rising above the rising longer term averages (blue) with a white space between them. Thus, LMAT had an RWB pattern and is a launched rocket stock. In other words, it was an advancing stock that had rested for at least 3 months (formed a base) and broken to an all-time high.
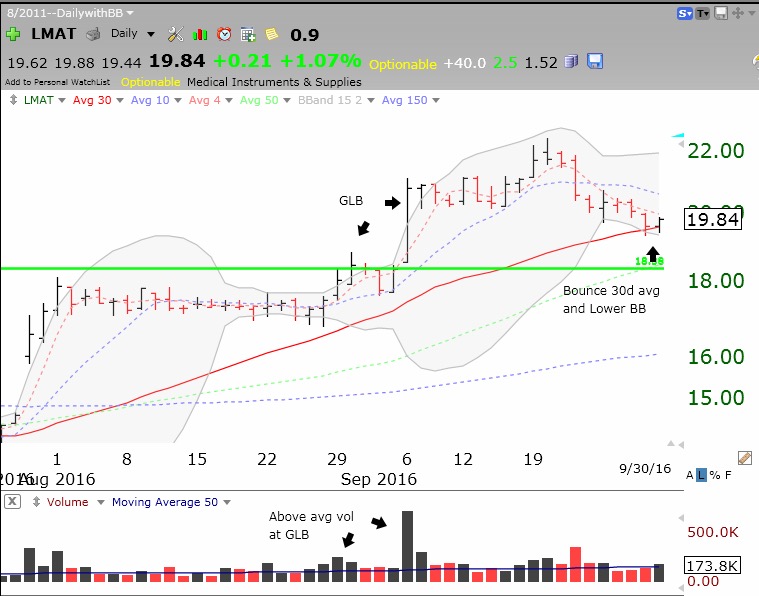
LMAT closed above its green line 2 times on above average trading volume (see daily chart below). The first time the break-out failed, as it traded back below its green line for 3 days. (I immediately sell failed break-outs.) Then LMAT had a much larger break-out on considerably higher trading volume. If I missed that break-out or had exited after the failure, then I wanted to enter this rocket after a decline to short term support and a likely resumption of the up-trend. That happened on Friday when LMAT bounced up off of its rising 30 day average and its lower daily 15.2 Bollinger Band on increased volume. This is one of my favorite set-ups. If I were to buy LMAT on Monday I would do so and place a sell stop around the low of the bounce, near 19.29. However, I must sell immediately if the bounce I bought on does not hold. One never knows in advance if a particular set-up will be successful. Of course, I would first check LMAT’s news and fundamentals to make sure that it was worthy of my risking capital to purchase it. For example, IBD gives LMAT a composite ranking of 99, the highest possible reading.
I actually use TC2000 to scan for stocks with this set-up. By the way, the Worden people are presenting a workshop in the DC area next weekend. Will see you there on Saturday…
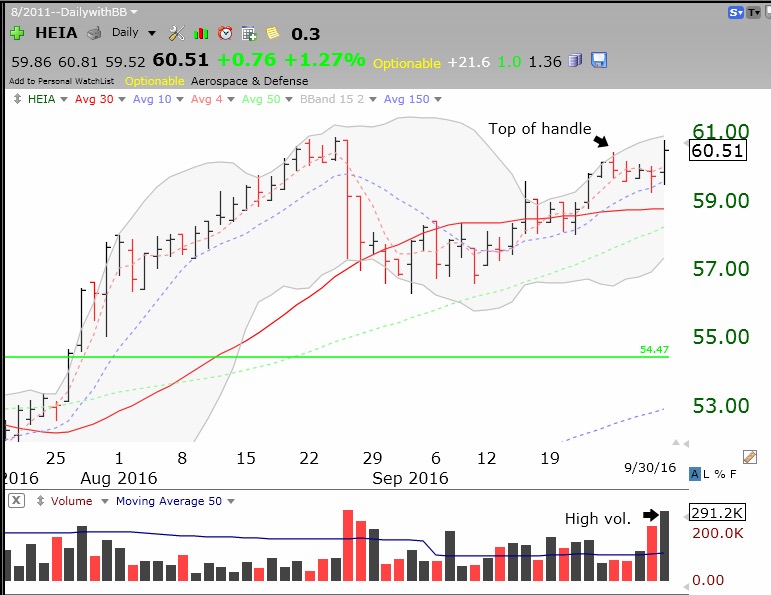
I noticed this possible cup and handle break-out from Friday. Note HEIA is above its last green line top–a good sign. It also has a nice RWB pattern (not shown). I do not like the high volume down day in the handle on Friday, just before Friday’s bounce, however. IBD composite rating for HEIA= 98. Let’s see if HEIA holds this break-out on Monday.
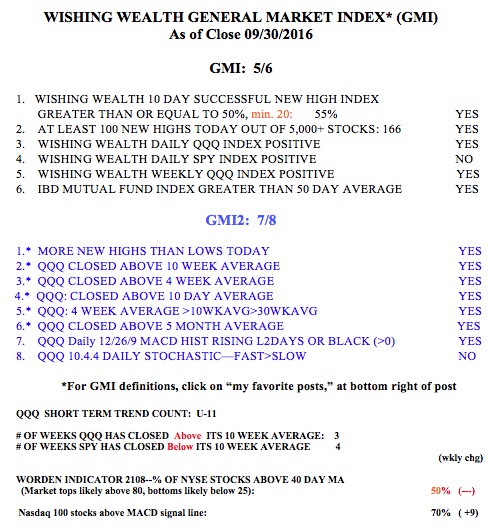
The GMI remains Green. Note the QQQ short term up-trend is now 11 days old. Since that short term signal at the close on 9/16 through Friday’s close, the QQQ has advanced +1.22% and the leveraged 3X bullish ETF, TQQQ, +3.37%.