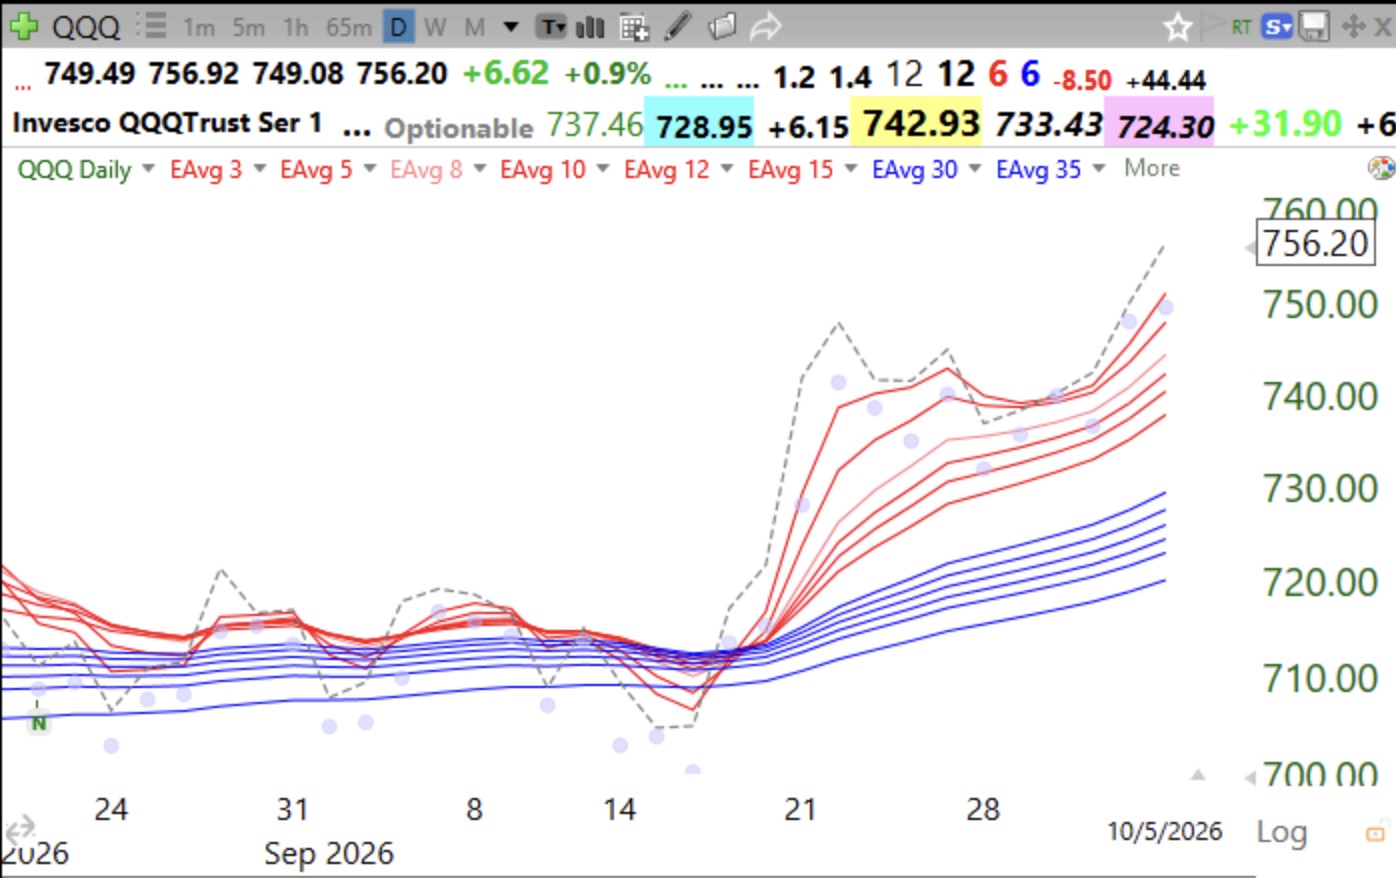
Day 1 of $QQQ short term up-trend; Modified daily Guppy chart of QQQ no longer shows BWR down-trend. Is an RWB up-trend on deck? Stay tuned.

GMI4/6
GMI-26/9
T210855%

This has been an an incredibly difficult market in which to trade profitably.  New short term up-trends often fail within 5 days. If this new up-trend can get past 5 days, we might see a significant tradable rise. The GMI is still Red but could turn Green on Thursday.  Watch to see whether QQQ can continue to close above all of these 12 averages. Dotted line shows daily closes.

Screenshot


Blog: Day 20 of $QQQ short term down-trend; GMI=2, see table; QQQ is below its 4wk and 10wk average but is holding its critical 30 wk average, see weekly chart.

GMI2/6
GMI-23/9
T210846%

This week is critical for telling us whether QQQ will hold. It remains in a Stage 2 up-trend, above its rising 30 week average. But it may retest its last green line break-out at 637.01. A weekly close below that level would be a major sign of weakness.

A GMI of 2 is too weak for me to trade growth stocks now. The weekly 10.4 stochastic is now down to 30. A value above 80 is a sign of a strong up-trend. The post-earnings period could be very bad. Cash is king right now.

Screenshot