GMI: 3; GMI-R: 6; Day 2 of QQQQ up-trend; CPST–a Judy’s pick

The GMI is still 3 (of 6) but the GMI-R fell one, to 6 (of 10).  This is because there were  only 27 new highs and 28 new lows in my universe of 4,000 stocks on Wednesday.  The indicators in the GMI have kept me out of all major market declines since 1995,  including the bad markets of 2001-2002.  I then got back in the market in 2003  and my account was up over 50% that year.  I also avoided the decline that began last January, which lasted 55 days.  The new QQQQ short term up-trend is in its second day and I am beginning to wade into this market slowly by buying QLD and writing some covered calls.  If this up-trend should end quickly, I will get out and go immediately to cash again.  There is always time to catch a real up-trend that can last months……. 

The service that I use to scan stocks for writing covered calls is at www.poweropt.com. I like this service because I can narrow down my scan to include only IBD100 stocks.  The IBD100 stocks include the strongest stocks based on fundamentals and technical action as assessed by IBD.  I also eliminate stocks that will report earnings during the option period.  I was burned several times by writing covered calls on stocks that announced earnings and then plunged.  In a market up-trend writing calls on growth stocks with large premiums is the easiest and least stressful way I have ever made money in the market. Joseph Hooper’s book educated me about this new way to look at writing covered calls for income. While I do not follow his method of stocks selection and technical analysis, I do like his philosophy of writing near month covered calls for 3-5% income each month.  I do all of this trading in my IRA and do not have to worry about taxes.  Check it out…

My friend Judy, who is the best stock picker I have met, buys stocks based on concepts long before the technical action meets my requirements. Cpst
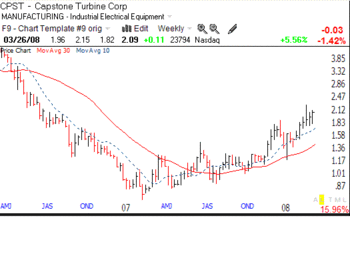
When she told me about this stock that she bought for about $1 per share, I told her I do not buy cheapies. But the stock has been rising, so I bought some around $2.09.  CPST makes microturbine engines and appears to be getting a lot of contracts.  If Judy likes a concept, it is good enough for me–as long as the chart looks good.  This weekly chart shows that CPST is now holding well above  its rising 10 week average (dotted line), which in turn is above its rising 30 week average (red line).  As long as the stock holds above this dotted line, now at 1.73, I will hold the stock.  This is not a recommendation, just an example of the chart pattern I look for and how I limit my risk.  By the way, most recent volume spikes are occurring on up weeks, suggesting strong buying. So, again, Judy buys at a price much lower than I do… 
Newdisclaimer

GMI: 3; GMI-R:7; New QQQQ up-trend; QLD and covered calls

The GMI is now at 3 and the GMI-R is at 7.  February 27 was the last time the GMI was as high as 3.  More important, Tuesday was the first day of a new short term up-trend in the QQQQ.  The down-trend that just ended lasted 55 days.  No one can accurately predict how long this new up-trend will last, but I have to trade with the trend.  If this up-trend  ends abruptly, I will just go back to cash.  I trade in my IRA where there are no tax consequences from getting in and out of a position.  And by using a deep discount broker, commissions are not a factor.  I have therefore been buying the QLD, an ultra ETF that aims to move up (or fall) twice as much as the underlying QQQQ ETF (Nasdaq 100 index) moves.  I have also started to buy some strong growth stocks and to write April calls on them.  I am very happy to sell calls for a 3-6% premium for a one month period.  Yes, I give up any  appreciation in the stock above the strike price.  But I will be very happy to make 3-5% each month on my portfolio. When one sells covered calls to speculators, one profits similar to the way that casinos do.  I am taking money from  persons who are gambling on a rise in the options I sell them.  I use technical analysis and an option scanning service to identify stocks on which to write call options. I also only write calls that will expire within one month and take limited positions in any one stock.  As always, however, the key to success is to trade consistent with the general market’s trend.  I only write calls during a market up-trend. In future posts I will provide examples of some of these trades.

Newdisclaimer

GMI: 4; GMI-R: 8; GMI performance; Judy’s pick: CYTR

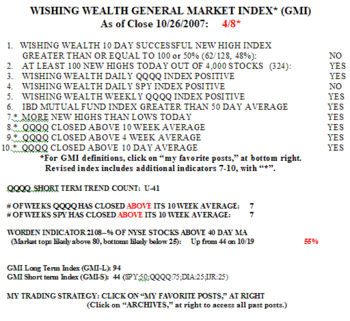
The GMI fell one, to 4, as my 10 Day Successful New High Index turned negative–barely. (Click on Table to enlarge.) Gmi1026  This index measures the number of stocks that hit a new high 10 days ago that closed higher than they did 10 days earlier.  (In a strong market, stocks should rise after hitting new highs.) The GMI-R also fell one, to 80% for the same reason.  If the SPY holds its own on Monday, the Daily SPY Index will turn positive.  The QQQQ is in the 41st day of its short term up-trend and the QQQQ and SPY have closed above their 10 week averages for 7 weeks.  (I typically make money trading growth stocks when the QQQQ is consistently above its 10 week average.) The longer term trends are strong, with the GMI-L now at 94%.  The Worden T2108 indicator is now back to 55%, up from its recent low of 44%….

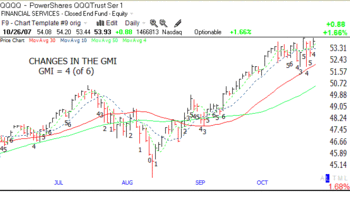
The GMI continues to do its job of defining the QQQQ trend.  I will trade long  in the market as long as the GMI is greater than 2.  Gmiperf1026 (Click on chart to enlarge.)   I continually have to learn the lesson that if I would just ride the QQQQ up-trend by holding the Pro Shares Ultra-QQQQ ETF, QLD (the QLD aims to rise or fall twice as much as the QQQQ), I can virtually outperform every other strategy I am likely to pursue.  Thus, since the GMI turned 3, on August 31, the QQQQ has risen 10.35% and the QLD by 20.07%.  How many of us have had their portfolio rise more than 20% in this time period, with a single trade?  Since August 31, only 19% of the Nasdaq 100 stocks and 7% of the S&P500 stocks have risen more than 20%, along with 34%of the stocks on the IBD100 list published on August 18.  We would have had to have been pretty lucky to select an entire portfolio of individual stocks that would have outperformed just sitting in the QLD! So many traders are interested in being right (proving their strategy or that they are smart), instead of just making money.  I continually have to resist falling into this trap…..

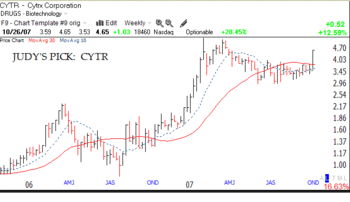
As I have written before, my friend Judy is an excellent stock picker who thoroughly researches a stock and only buys it after she has fallen in love with its concept. Well, Judy recently told me about a stock in the promising RNAi field.  You can look up this exciting technology yourselves by going to the company’s home page.  Well, I don’t like cheap stocks and I always subject Judy’s picks to my own technical analysis before I buy. Cytr  She buys at much lower prices than I do and amusingly watches others buy at higher levels as brokerage analysts discover her picks. So Judy told me about CYTR, which I did buy around $3.50.  The stock closed Friday at $4.65 up 12.59% for the day and 28.45% for the week!  CYTR has a lot of technical strength, so I thought I would share it with you, not as a recommendation, but to show you some signs that I look before I buy a stock.  (Click on chart to enlarge.) The weekly chart shows that CYTR has now closed above its 30 week average (red line), a critical buy signal for me.  It is also coming off of a nine month base that came after a huge rise. As you know, I like to buy stocks that have already doubled, and CYTR is up 250% in the past year.  And other RNAi stocks (ALNY, ISIS) are strong.  If CYTR’s clinical trials prove successful and the stock becomes a big winner, I will have plenty of time to average up as the stock climbs….

Blogdisclaimer