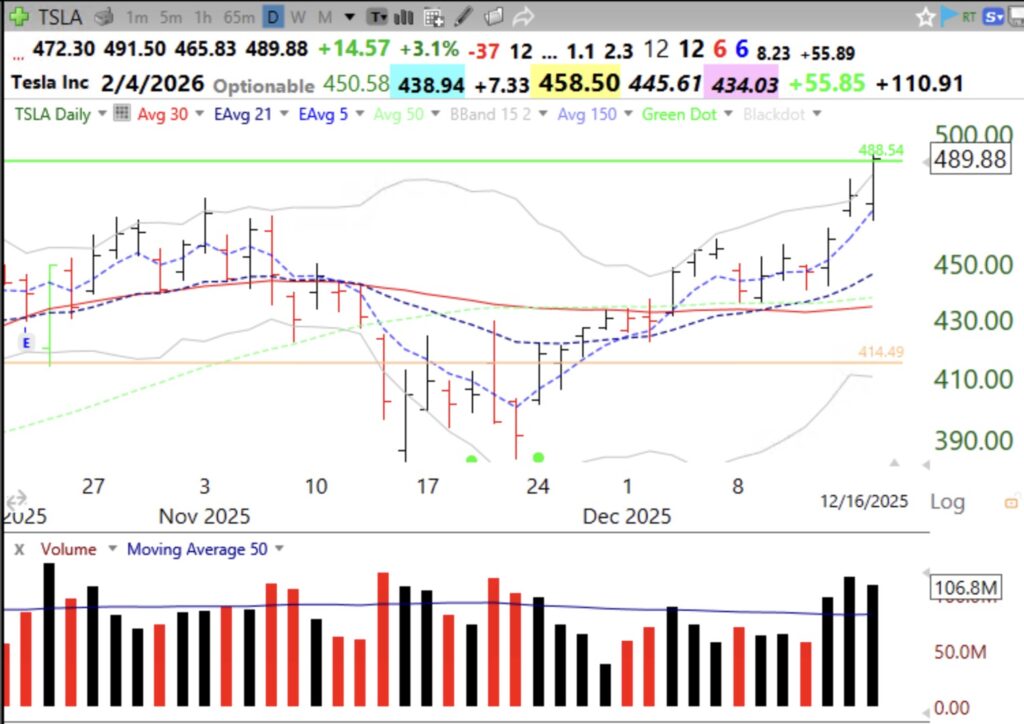
Blog Post: Day 2 of $QQQ short term down-trend; However, $TSLA has high volume GLB, see daily chart. Will it succeed? Must not close below green line, @488.54. Also looks like a cup with handle break-out.
2 thoughts on “Blog Post: Day 2 of $QQQ short term down-trend; However, $TSLA has high volume GLB, see daily chart. Will it succeed? Must not close below green line, @488.54. Also looks like a cup with handle break-out.”
Is there a post explaning the short term Qqq gmi indicator? I havent found it, only for gmi1
Loading...
Hi Dr Wish,
I’ve been watching many of the videos you have with trader lion, where can I find the code for scans GLB, ATH blue dot etc…I do use tc 2000. Thank you
Is there a post explaning the short term Qqq gmi indicator? I havent found it, only for gmi1
Hi Dr Wish,
I’ve been watching many of the videos you have with trader lion, where can I find the code for scans GLB, ATH blue dot etc…I do use tc 2000. Thank you