"One successful trade makes us feel good. Two successful trades in a row make us feel pretty smart. Three consecutive successful trades makes us feel like a genius. That’s when they get us…" Gerald Appel (2005, p. 224)
Appel’s new book, Technical Analysis– Power Tools for Active Investors, is the most refreshing and clearly written discussion of a select number of technical indicators that I have had the pleasure to read. If you have read Stan Weinstein’s introduction to technical analysis (listed in my favorite books section to the right) you are ready to proceed to this engaging and personally written book by the inventor of the MACD indicator. (I earn absolutely nothing from the sales of these books)………………….
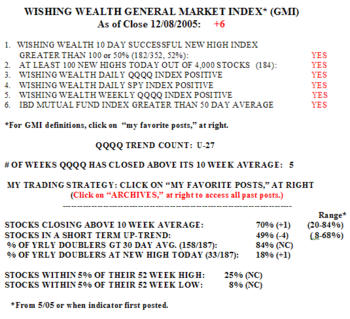
The GMI weakened a little on Friday. Fewer than 50% of the 158 stocks that hit a new high ten days earlier closed higher than they did ten days ago. In other words, stocks hitting new highs have not tended to rise. Failed breakouts in growth stocks is often a sign of a topping market. 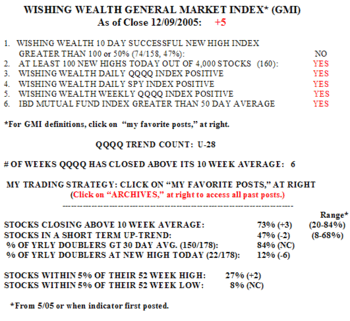 But this is only one sign and the up-trend is still intact. There were 160 new yearly highs in my universe of 4,000 stocks and 73% of stocks closed above their 10 week averages. However, only 47% of stocks are in a short term up-trend, down from 65% on 12/2. So the weakness is apparent in the short term indicators. While all weakness, by definition, shows up in these indicators first, it is not certain that the longer term indicators will also weaken. While 84% of the stocks that have doubled in the past year closed above their 30 day averages, only 12% of them hit a new high on Friday. Still, 27% of stocks are within 5% of a new high, compared with 8% close to a new low. Friday was the 28th day of the up-trend (U-28) and the QQQQ has closed above its 10 week average for the past six weeks.
The WPM short term indicators show marked deterioration in the components of the five indexes. 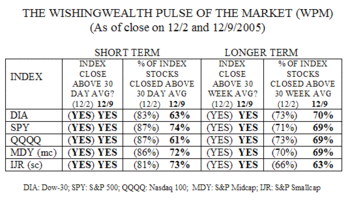 All indexes closed above their 30 day and 30 week averages. However, only 61-74% of their component stocks closed above their 30 day averages, down from 80%+ last week. There was greater short term weakness in the DIA (63%) and QQQQ (61%) stocks. There were also very small declines in the percentage of stocks closing above their 30 week averages. The short term weakness occurred across the board and reminds me to trade with more caution. While it is often said that small cap stocks gain strength in the new year, there is no evidence of impending strength yet. Small cap stocks are among the weakest, with only 63% above their 30 week averages. The bottom line for me is to keep my sell stops tight so that I do not lose too much of my recent profits if the decline continues………………..
I ran some scans of the market for weak stocks and sectors. I was surprised to find so many municipal bond and other interest sensitive ETF’s near 52 week lows. This chart of the Lehman 20+ year treasury bond ETF demonstrates how long term rates appear poised to rise. 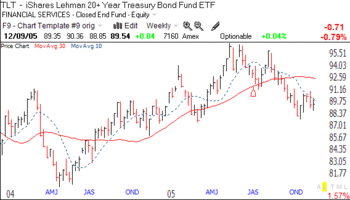 Note that for the first time since August 2004, the 10 week average (dotted line) is below the 30 week average (red line) a sign of considerable weakness. Higher long term rates may be on the horizon. It probably explains why my scan also found plenty of housing stocks in steady downtrends and hovering near their 52 week lows. Another weak group that came up is publishing/media. Stocks such as NYT, DJ, KRI, LEE, JRC, WPO, GCI also are in confirmed down-trends. There are always some stocks to satisfy the bears, even as the bulls feast………………..
I often talk about the benefits of buying back a stock that I sold at a loss if it quickly begins to rise. A reader asked me whether I am concerned with the IRS wash sale rules. I replied that the wash sale rule does not apply to me when I trade in my IRA, since I pay no taxes on transactions until I withdraw the funds at retirement. For many years I had misunderstood the wash sale rule. The wash sale rule is designed to prevent people from intentionally creating a tax loss (usually at the end of the year) in a security they own by selling it and then buying it back within 30 days. As the educational link above explains, one does not really lose the tax loss, but only defers taking it until the subsequent securities purchased are sold. The loss from the first sale is added to the cost basis of the second transaction. So in taxable accounts, the wash sale rule is not a valid reason to avoid buying back a stock that we sold at a loss, if it rebounds (an all too common occurrence for me–consult with your accountant)…………….
NOTE: A NEW SECTION TO THE BOTTOM RIGHT PROVIDES LINKS TO MY FAVORITE PRIOR POSTS. THESE INCLUDE MY STRATEGY POSTS, DEFINITIONS OF THE GMI COMPONENTS, AND MY ANALYSIS OF WHY THE TRADING TECHNIQUES OF THE GREAT NICOLAS DARVAS WORK BEST DURING BULL MARKETS AT ALL-TIME HIGHS.
How have you used this site to inform your trading? Can you send me some experiences I can post for others (anonymously, with your prior permission)? Please send your pearls of Wishdom to me at: silentknight@wishingwealthblog.com.
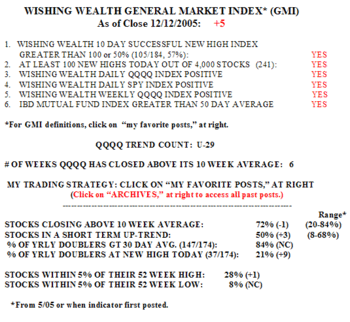 There were 241 new highs in my universe of 4,000 stocks and 105 10 day successful new highs (stocks that hit a new high 10 days ago and closed higher Monday than ten days earlier). 57% of the Nasdaq 100 stocks advanced on Monday, along with 50% of the S&P 500 stocks and 47% of the Dow 30 stocks. The Dow 30 stocks continue to lag the others. One half of stocks are in a short term up trend and 21% of stocks that have doubled hit a new high on Monday. 84% of doublers remain above their 30 day averages and 72% closed above their 10 week averages. The rally is still on track and is in its 29th day. The leaders are holding up well. Check out HANS, AAPL, GOOG, NTRI and CUTR………………………


