The GMI declined one, to 5, as there were only 96 stocks that hit a new high 10 days ago and closed higher on Monday than they closed 10 days ago. (I count 50% as positive for this indicator only if there were too few new highs 10 days earlier to achieve the required 100.) 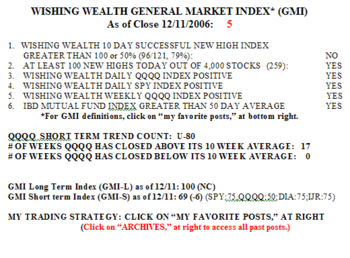 50-56% of the stocks in the Nasdaq 100, S&P 500 and Dow 30 indexes rose on Monday. There were 259 new 52 week highs in my universe of 4,000 stocks. 53% of the IBD 100 stocks published on 11/20 rose and 20 of them hit a 52 week high. The GMI-S slipped 6, to 69, as one of the short term indicators for the IJR (S&P smallcap 600 ETF) turned negative. Monday was the 80th day of the current QQQQ up-trend.
ETF
GMI: 6; Follow instruments and/or gut? IBD100 stocks thrive
The GMI remains at a maximum of 6. 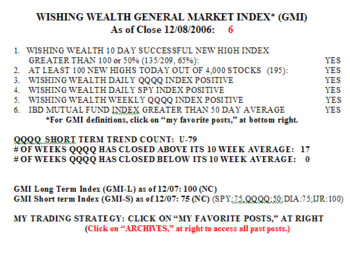 There were 195 new yearly highs in my universe of nearly 4,000 stocks on Friday and Friday was the 79th day in the QQQQ up-trend. 55-62% of the stocks in the Nasdaq 100, S&P 500 and Dow 30 indexes advanced on Friday.
With my market indicators so positive, some of you have written to me asking me why I have been raising cash and even taking on a position in QID, the ultra inverse ETF for the QQQQ. You raise an important question that I have been struggling with. Why not stay with the up-trend signaled by the GMI and not try to anticipate a change in trend? You may be right– maybe I should fly on instruments. But doing so subjects me to a possible large cut in my profits because my indicators will only call the peak after the indexes have fallen some. So, to retain profits I have decided to cut back.
Furthermore, while the GMI indicates that the up-trend is intact, there are a number of other signs that make me cautious: 1) there are twice as many bullish than bearish newsletters; 2) some market leaders (GOOG, AAPL and RIMM) have stopped hitting new highs; 3) the MACD for the QQQQ is declining; 4) the QQQQ has closed 7 of the past 10 days below its 10 day average; and 5) market peaks have been common in December the past 5 years.
In addition to the above, I prefer to phase in and out of my positions in the market index ETFs. When I turned bullish I bought on the way up. Now, I am simply cutting back in stages. If it turns out that some of the warning signs above lessen or reverse, I will buy more QLD again…..
Meanwhile the IBD 100 lists in the recent past have done quite well. 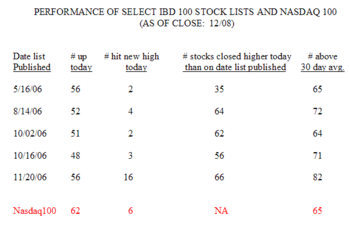 Four of the five lists closed higher than on the day they were published. 64-82% of the individual stocks closed higher than their 30 day averages. The list from 11/20 had 16 new yearly highs on Friday. Compared with the Nasdaq 100 stocks, the IBD 100 type of growth stocks appear to be thriving in this market.
GMI: 6; Leaders continue to weaken; QQQQ up-trend looking tired
While the GMI is still at 6, the market looks weak to me. 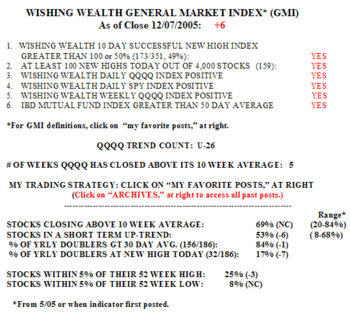 Yes, there were 332 new yearly highs in my universe of 4,000 stocks. But only 14% of the Nasdaq 100 stocks advanced on Thursday, along with just 26% of the S&P 500 stocks and 37% of the Dow 30 stocks. And only 29% of the IBD 100 stocks from 11/20 rose. And GOOG closed below its 30 day average, as did RIMM (barely). And AAPL fell 3.1%. When the market leaders can’t command higher prices, it bodes poorly for the other troops. So I am back to 70% cash as I wait to see if the market up-trend is ending. QID, the inverse ultra QQQQ ETF that is designed to increase as the QQQQ falls, increased 1.35% on Thursday on the highest up volume since this ETF was launched in September. A lot of money is betting that the QQQQ will decline–as have I. I have been slowly transferring my money from QLD to QID. This QQQQ up-trend at 78 days is looking mighty tired to me….
