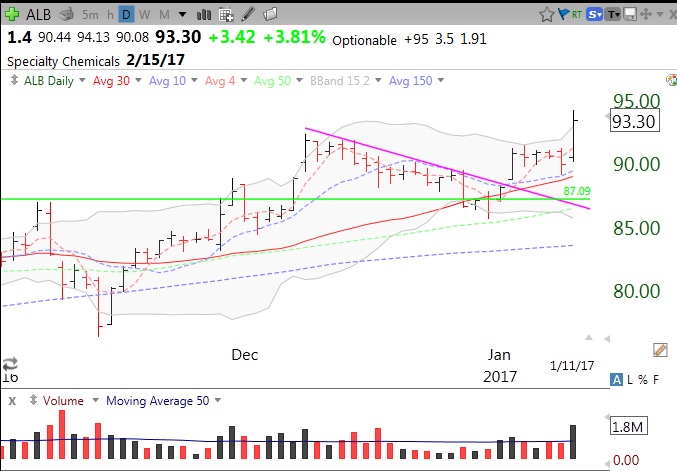
ALB had a high volume move up to an ATH after retesting its GLB on Wednesday.
Stock Market Technical Indicators & Analysis
ALB had a high volume move up to an ATH after retesting its GLB on Wednesday.
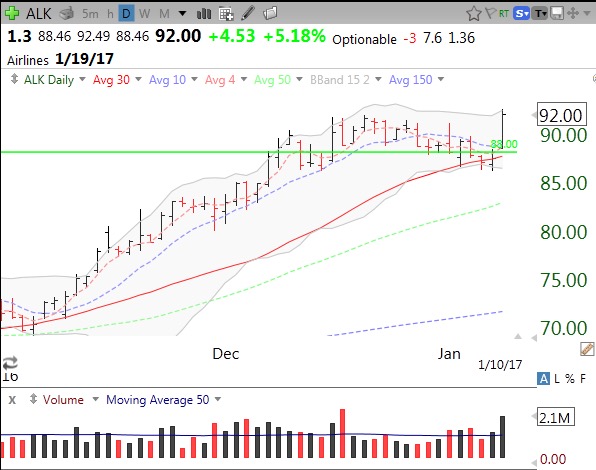
AlK successfully retested its recent GLB to an ATH on above average volume. Reports earnings on 1/19.
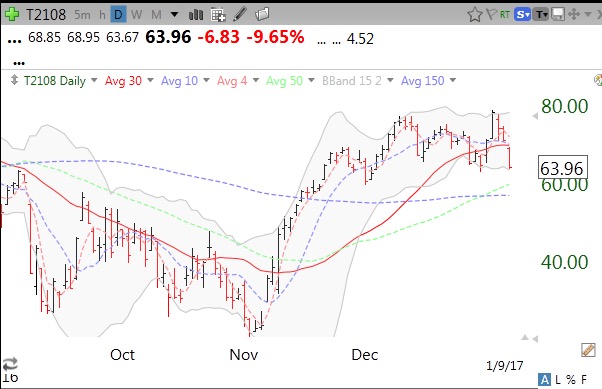
The split market continues as the tech stocks represented by the QQQ shine brighter than other stocks. The T2108 has fallen to 64% after being above 70 all last week. The T2108 measures the percentage of NYSE stocks that closed above their 40 day simple moving averages. Below is the daily chart of the T2108, available in TC2000.