Skip to content

Wishing Wealth Blog

Stock Market Technical Indicators & Analysis

  • Home
  • About
    • Disclaimer
    • Contact
  • Recommended Reading
  • Topics
    • General Market Index (GMI) table
    • Nicolas Darvas
    • My Favorite Posts
    • Tutorial
    • UMDSMC Education Posts
    • Video blog
  • Webinars
    • TraderLion 25 Annual Conference
    • 2025-07-17 Long Island Traders Meetup
    • Boston IBD Meetup, May 21, 2025
    • 01/2024 NoVA IBD Meetup
    • AAII
      • Eastern Michigan – 01/2022
      • Research Triangle – 12/2021
    • 2021 TraderLion Presentation
    • 2022 TraderLion Webinar
    • TC2000 User Group – December 2012
    • 2012 Houston TC2000 Webinar
    • Doctor’s Orders – August 2010
    • A Word from Dr. Wish – April 2010
    • Other Dr. Wish Videos…
  • Glossary
  • $25 Coupon for TC2000

20th day of $QQQ short term up-trend but more new lows than highs

Wednesday, August 9, 2017 @ 10:30 pm by Dr. Wish
GMI4/6
GMI-26/9
T210846%

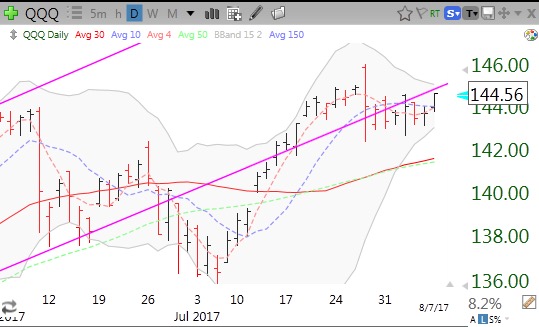
Only 28% of U.S. stocks rose. QQQ still between narrow Bollinger Bands.


Leave a comment

19th day of $QQQ short term up-trend

Wednesday, August 9, 2017 @ 6:38 am by Dr. Wish
GMI5/6
GMI-27/9
T210849%

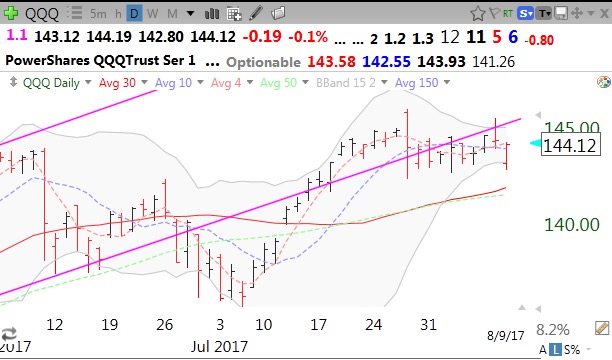
QQQ still holding between 15.2 daily Bollinger Bands.


Leave a comment

18th day of $QQQ short term up-trend; $QQQ up against Bollinger pinch

Monday, August 7, 2017 @ 9:30 pm by Dr. Wish
GMI5/6
GMI-27/9
T210852%

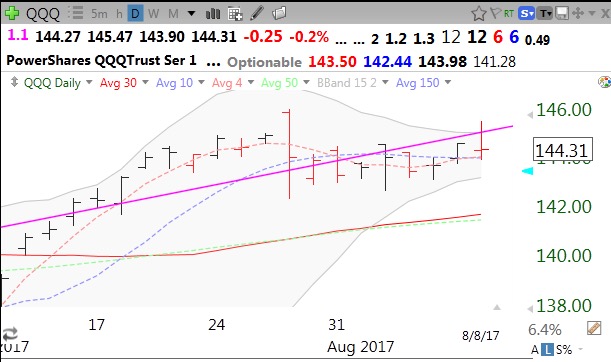
Will QQQ break through upper 15.2 daily Bollinger Band?


Leave a comment
Older posts
Newer posts
← Previous Page1 … Page622 Page623 Page624 Page625 Page626 Page627 Page628 … Page1,546 Next →

Current GMI Signal

RED

since close on Mar 6, 2026

Successful GLBTracker

Selected stocks that have had a successful recent Green Line Breakout (GLB). One can really profit by buying stocks breaking out to all-time highs after a consolidation of 3 months or more, my GLB Setup.

Sym.DateGLB $Now $Chg.
ENLT6/18/25$20.44$74.59264.92%
SFM1/29/24$49.45$77.1756.06%
CRS4/23/24$79.66$435.30446.45%
AGX9/6/24$76.70$603.84687.28%
SATS8/26/25$50.21$128.59156.10%
APP9/17/24$116.09$391.38237.13%
EAT10/1/24$78.33$155.1398.05%
PLTR11/5/24$44.91$128.11185.26%
ALMS1/6/26$13.53$23.0570.36%
BE8/22/25$44.95$166.70270.86%
CLS5/1/25$87.00$351.31303.80%
RGC5/1/25$1.55$28.821759.35%
CCJ6/9/25$62.55$116.0485.52%
RHLD8/12/25$54.05$158.67193.56%
GEV5/20/25$447.50$991.32121.52%
CLS6/25/25$144.27$351.31143.51%
MIRM8/7/2025$54.23$95.2075.55%
CCJ6/9/25$62.55$116.0485.52%
WDC9/4/25$86.66$343.43296.30%
SNDK9/4/25$58.36$851.771359.51%
STX6/3/2025$117.67$503.13327.58%
TTMI6/3/25$30.41$121.49299.51%
MU9/29/25$157.54$420.59166.97%
INBX7/8/25$18.95$75.27297.20%
SPHR9/11/25$56.08$128.40128.96%
FIX7/24/25$553.09$1,592.84187.99%

Indicators in your Inbox

Get new posts by email:
PopularMost DiscussedRecent
  • About the General Market Index (GMI)
  • Welcome to the new *and improved* Wishing Wealth
  • How to use IBD 100 and New America stocks and TC2007 to find potential rocket stocks; Market rally begins
  • The new 3x ETF’s–triple your pleasure — or pain
  • 6th day of $QQQ short term down-trend; GMI could signal a Buy
  • In the hospital. Will resume posting next week. Thank you for your patience.
  • How I use put options as investment insurance
  • My first YouTube Vlog (video blog) Post: Sell in May and Go Away?
  • So, Wishing Wealth Reader, Tell Us About Yourself…
  • Blog post: David, my co-presenter, brilliant colleague of 20+ years died in a freak accident on 2/18; Day 35 of $QQQ short term down-trend; 15 promising stocks to monitor
  • Blog Post: Day 1 of $QQQ short term up-trend; GMI=5; 113 US stocks reached an ATH; QQQ retakes 30 week average, but must hold above it to possibly begin a Stage 2 up-trend, but we are not there yet. Also, watch the 10 week average.
  • Blog Post: Day 41 of $QQQ short term down-trend; $QQQ finishing Stage 3 and may begin Stage 4 decline; I never fight the market’s trend. Only young people can wait out a decline and recovery. I believe that Boomers belong on the sidelines, protecting their hard earned savings and investments.
  • Blog post: Day 40 of $QQQ short term down-trend; Daily modified Guppy chart told you to get out of $RH long before Wednesday’s 19% drop. All major indexes remain in BWR down-trends. See $USO RWB up-trend.
  • Blog post: Day 39 of $QQQ short term down-trend; GMI=0; $QQQ weekly chart below shows continuing significant down-trend with 4wk avg<10wk avg<30wk avg; waiting for a confirmed new up-trend.
  • Blog Post: Day 37 of $QQQ short term down-trend; GMI=1 and 10 week average closes week below 30 week average, see weekly chart. Stage 4 down-trend likely.

Blogroll

  • Barchart All-Time Highs
  • Blue Collar Investor
  • CNNMoney: Pre-market Futures
  • Dark Liquidity
  • Seeking Alpha
  • Stock Chartist

Recommended Reading

QQQ and TQQQ ETF Profit Machine Momentum Masters - A Roundtable Interview with Super Traders - Minervini, Ryan, Zanger & Ritchie II Alan Ellman's Selling Cash-Secured Puts: Investing to Generate Monthly Cash Flow Stock Investing For Students - a plan to get rich slowly and retire young Trade Like a Stock Market Wizard: How to Achieve Super Performance in Stocks in Any Market Exit Strategies for Covered Call Writing: Making the Most Money When Selling Stock Options Complete Encyclopedia for Covered Call Writing Wall Street The Other Las Vegas How to Make Money in Stocks: A Winning System in Good Times and Bad, Fourth Edition Trend Trading: A seven step approach to success How Legendary Traders Made Millions: Profiting From the Investment Strategies of the Gretest Traders of All time The Complete TurtleTrader: The Legend, the Lessons, the Results How to Make Money Selling Stocks Short Reminiscences of a Stock Operator Stan Weinstein's Secrets For Profiting in Bull and Bear Markets Lessons from the Greatest Stock Traders of All Time How I Made $2,000,000 In The Stock Market

Archives

© 2026 WishingWealthBlog.com
 

Loading Comments...