Skip to content

Wishing Wealth Blog

Stock Market Technical Indicators & Analysis

  • Home
  • About
    • Disclaimer
    • Contact
  • Recommended Reading
  • Topics
    • General Market Index (GMI) table
    • Nicolas Darvas
    • My Favorite Posts
    • Tutorial
    • UMDSMC Education Posts
    • Video blog
  • Webinars
    • 2026-04 MoneyShow Virtual Booths
    • TraderLion 25 Annual Conference
    • 2025-07-17 Long Island Traders Meetup
    • Boston IBD Meetup, May 21, 2025
    • 01/2024 NoVA IBD Meetup
    • AAII
      • Eastern Michigan – 01/2022
      • Research Triangle – 12/2021
    • 2021 TraderLion Presentation
    • 2022 TraderLion Webinar
    • TC2000 User Group – December 2012
    • 2012 Houston TC2000 Webinar
    • Doctor’s Orders – August 2010
    • A Word from Dr. Wish – April 2010
    • Other Dr. Wish Videos…
  • Glossary
  • $25 Coupon for TC2000

Put/call ratio= 1.05, close to a bounce; $TLT keeps falling

Wednesday, October 25, 2017 @ 10:59 pm by Dr. Wish
GMI5/6
GMI-24/9
T210857%

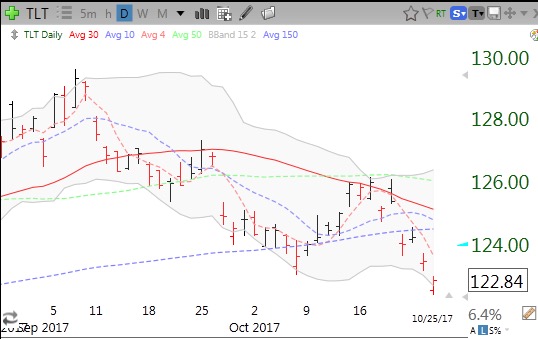
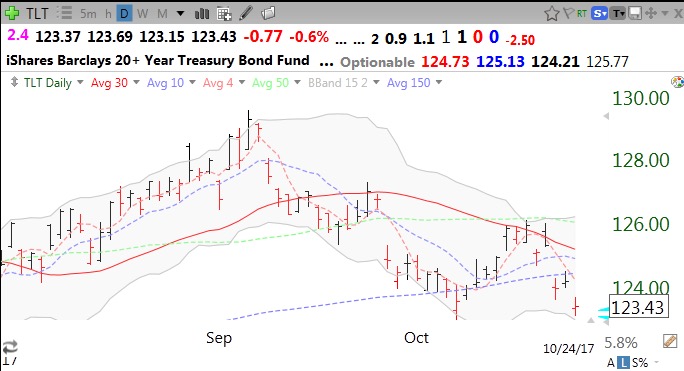
The put/call ratio is suggesting extreme bearishness among option traders. A reading larger than 1.1 generally leads to a bottom or at least a bounce. Much of the decline may be a reaction to falling bonds and higher interest rates, reflected in the continuing decline in TLT.


Leave a comment

19th day of $QQQ short term up-trend; bonds weak

Tuesday, October 24, 2017 @ 11:37 pm by Dr. Wish
GMI6/6
GMI-24/9
T210863%

20 yr treasury bonds continue to weaken.

Leave a comment

GMI-2 falls to 4 (of 8); $ZAGG holds green line, at all-time high

Monday, October 23, 2017 @ 8:25 pm by Dr. Wish
GMI6/6
GMI-24/9
T210864%

The GMI-2 is a collection of my most sensitive indicators. They are suggesting weakness in growth stocks. In spite of this weakness, ZAGG held its green line on Monday and closed at an all-time high.

Leave a comment
Older posts
Newer posts
← Previous Page1 … Page616 Page617 Page618 Page619 Page620 Page621 Page622 … Page1,557 Next →

Current GMI Signal

GREEN

since close on APR 10, 2026

Successful GLBTracker

Selected stocks that have had a successful recent Green Line Breakout (GLB). One can really profit by buying stocks breaking out to all-time highs after a consolidation of 3 months or more, my GLB Setup.

Sym.DateGLB $Now $Chg.
ENLT6/18/25$20.44$85.73319.42%
SFM1/29/24$49.45$79.7861.33%
CRS4/23/24$79.66$581.77630.32%
AGX9/6/24$76.70$760.10891.00%
SATS8/26/25$50.21$0.20-99.60%
APP9/17/24$116.09$479.58313.11%
EAT10/1/24$78.33$169.40116.26%
PLTR11/5/24$44.91$113.04151.70%
ALMS1/6/26$13.53$25.6489.50%
BE8/22/25$44.95$269.16498.80%
CLS5/1/25$87.00$344.42295.89%
RGC5/1/25$1.55$6.18298.71%
CCJ6/9/25$62.55$104.8167.56%
RHLD8/12/25$54.05$130.08140.67%
GEV5/20/25$447.50$1,051.71135.02%
CLS6/25/25$144.27$344.42138.73%
MIRM8/7/2025$54.23$121.54124.12%
CCJ6/9/25$62.55$104.8167.56%
WDC9/4/25$86.66$596.01587.76%
SNDK9/4/25$58.36$2,162.533605.50%
STX6/3/2025$117.67$935.10694.68%
TTMI6/3/25$30.41$198.86553.93%
MU9/29/25$157.54$1,178.50648.06%
INBX7/8/25$18.95$94.15396.83%
SPHR9/11/25$56.08$166.39196.70%
FIX7/24/25$553.09$1,940.02250.76%

Indicators in your Inbox

Get new posts by email:
PopularMost DiscussedRecent
  • About the General Market Index (GMI)
  • Welcome to the new *and improved* Wishing Wealth
  • How to use IBD 100 and New America stocks and TC2007 to find potential rocket stocks; Market rally begins
  • The new 3x ETF’s–triple your pleasure — or pain
  • 6th day of $QQQ short term down-trend; GMI could signal a Buy
  • In the hospital. Will resume posting next week. Thank you for your patience.
  • How I use put options as investment insurance
  • My first YouTube Vlog (video blog) Post: Sell in May and Go Away?
  • So, Wishing Wealth Reader, Tell Us About Yourself…
  • Blog post: David, my co-presenter, brilliant colleague of 20+ years died in a freak accident on 2/18; Day 35 of $QQQ short term down-trend; 15 promising stocks to monitor
  • Blog: Day 2 of new $QQQ short term down-trend; A lot of key stocks are technically weak. Look at daily Guppy chart since June. Will stocks resume up-trend with 2nd Quarter earnings?
  • Blog: Day 7 of $QQQ short term up-trend, it may end Wednesday, but longer term trend remains up, see chart.
  • Blog: Day 6 of $QQQ short term up-trend; GMI= 6 (of 6). Market remains in short and longer term uptrends.
  • Blog: Day 1 of new $QQQ short term up-trend; All GMI components are positive. Short and longer term trends are up. But Mag7 stocks are weak, see daily Guppy chart of MAGS.
  • Blog: Day 43 of $QQQ short term up-trend, it could end on Wednesday; Longer term up-trend remains, see weekly chart. QQQ has found support at its rising 10 week average, but is below its 4 week. Note how long it held its rising 4 week average, quite a rally.

Blogroll

  • Barchart All-Time Highs
  • Blue Collar Investor
  • CNNMoney: Pre-market Futures
  • Dark Liquidity
  • Seeking Alpha
  • Stock Chartist

Recommended Reading

QQQ and TQQQ ETF Profit Machine Momentum Masters - A Roundtable Interview with Super Traders - Minervini, Ryan, Zanger & Ritchie II Alan Ellman's Selling Cash-Secured Puts: Investing to Generate Monthly Cash Flow Stock Investing For Students - a plan to get rich slowly and retire young Trade Like a Stock Market Wizard: How to Achieve Super Performance in Stocks in Any Market Exit Strategies for Covered Call Writing: Making the Most Money When Selling Stock Options Complete Encyclopedia for Covered Call Writing Wall Street The Other Las Vegas How to Make Money in Stocks: A Winning System in Good Times and Bad, Fourth Edition Trend Trading: A seven step approach to success How Legendary Traders Made Millions: Profiting From the Investment Strategies of the Gretest Traders of All time The Complete TurtleTrader: The Legend, the Lessons, the Results How to Make Money Selling Stocks Short Reminiscences of a Stock Operator Stan Weinstein's Secrets For Profiting in Bull and Bear Markets Lessons from the Greatest Stock Traders of All Time How I Made $2,000,000 In The Stock Market

Archives

© 2026 WishingWealthBlog.com

Loading Comments...