Skip to content

Wishing Wealth Blog

Stock Market Technical Indicators & Analysis

  • Home
  • About
    • Disclaimer
    • Contact
  • Recommended Reading
  • Topics
    • General Market Index (GMI) table
    • Nicolas Darvas
    • My Favorite Posts
    • Tutorial
    • UMDSMC Education Posts
    • Video blog
  • Webinars
    • 2026-04 MoneyShow Virtual Booths
    • TraderLion 25 Annual Conference
    • 2025-07-17 Long Island Traders Meetup
    • Boston IBD Meetup, May 21, 2025
    • 01/2024 NoVA IBD Meetup
    • AAII
      • Eastern Michigan – 01/2022
      • Research Triangle – 12/2021
    • 2021 TraderLion Presentation
    • 2022 TraderLion Webinar
    • TC2000 User Group – December 2012
    • 2012 Houston TC2000 Webinar
    • Doctor’s Orders – August 2010
    • A Word from Dr. Wish – April 2010
    • Other Dr. Wish Videos…
  • Glossary
  • $25 Coupon for TC2000

$ZAGG retakes green line

Tuesday, November 7, 2017 @ 11:04 pm by Dr. Wish
GMI5/6
GMI-28/9
T210851%

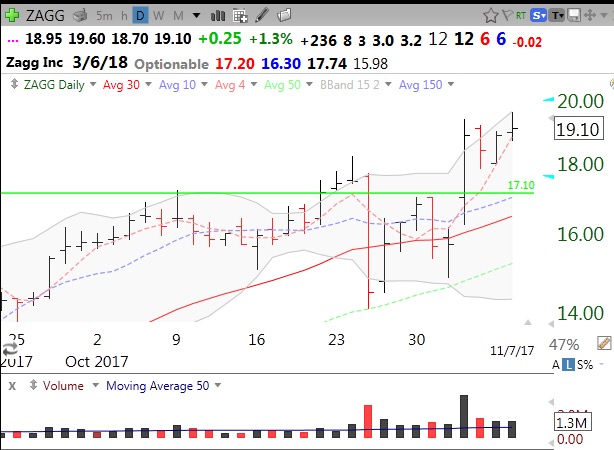
ZAGG hits all-time high (ATH) as it retakes GLB.
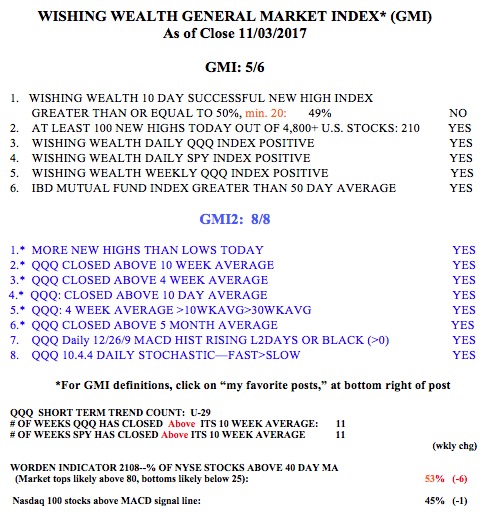

Leave a comment

Commodity ETF, $DBC, on the rise; 30th day of $QQQ short term up-trend

Tuesday, November 7, 2017 @ 12:23 am by Dr. Wish
GMI6/6
GMI-28/9
T210854%

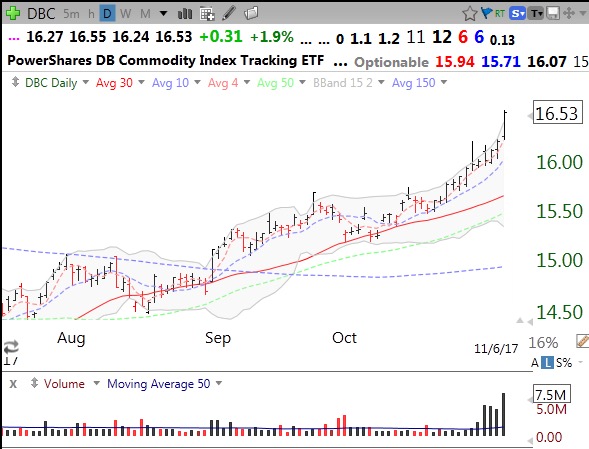
With DBC rising, can inflation and the Fed be far behind?


Leave a comment

GLB: $QLYS, $ZEN–worth watching

Sunday, November 5, 2017 @ 9:18 pm by Dr. Wish
GMI5/6
GMI-28/9
T210853%

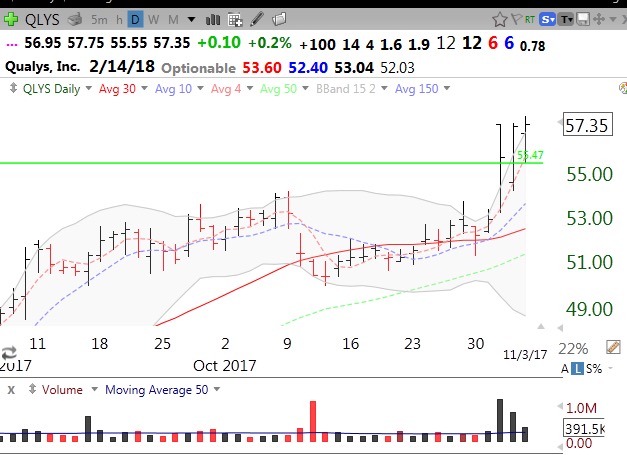
I noticed that QLYS had a high volume GLB last week.
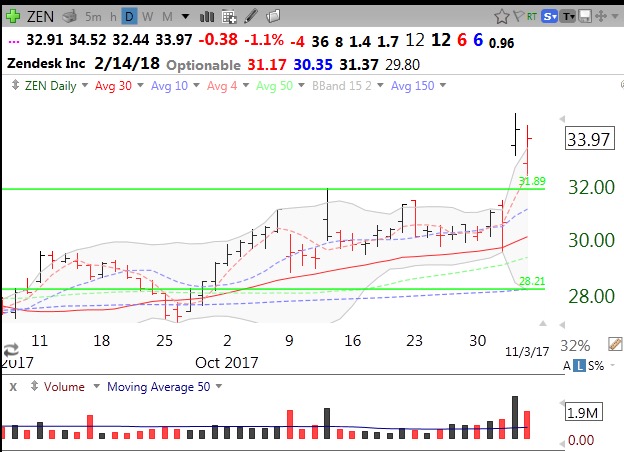
As did ZEN:

The GMI remains on a Green signal.


Leave a comment
Older posts
Newer posts
← Previous Page1 … Page613 Page614 Page615 Page616 Page617 Page618 Page619 … Page1,557 Next →

Current GMI Signal

GREEN

since close on APR 10, 2026

Successful GLBTracker

Selected stocks that have had a successful recent Green Line Breakout (GLB). One can really profit by buying stocks breaking out to all-time highs after a consolidation of 3 months or more, my GLB Setup.

Sym.DateGLB $Now $Chg.
ENLT6/18/25$20.44$85.29317.27%
SFM1/29/24$49.45$81.1064.00%
CRS4/23/24$79.66$586.92636.78%
AGX9/6/24$76.70$752.50881.10%
SATS8/26/25$50.21$0.20-99.60%
APP9/17/24$116.09$475.68309.75%
EAT10/1/24$78.33$170.19117.27%
PLTR11/5/24$44.91$112.50150.50%
ALMS1/6/26$13.53$26.1893.50%
BE8/22/25$44.95$268.44497.20%
CLS5/1/25$87.00$344.47295.94%
RGC5/1/25$1.55$6.28305.16%
CCJ6/9/25$62.55$105.0167.88%
RHLD8/12/25$54.05$126.46133.97%
GEV5/20/25$447.50$1,057.00136.20%
CLS6/25/25$144.27$344.47138.77%
MIRM8/7/2025$54.23$123.42127.59%
CCJ6/9/25$62.55$105.0167.88%
WDC9/4/25$86.66$604.69597.77%
SNDK9/4/25$58.36$2,155.853594.05%
STX6/3/2025$117.67$946.48704.35%
TTMI6/3/25$30.41$196.14544.99%
MU9/29/25$157.54$1,161.44637.23%
INBX7/8/25$18.95$93.81395.04%
SPHR9/11/25$56.08$167.37198.45%
FIX7/24/25$553.09$1,910.40245.40%

Indicators in your Inbox

Get new posts by email:
PopularMost DiscussedRecent
  • About the General Market Index (GMI)
  • Welcome to the new *and improved* Wishing Wealth
  • How to use IBD 100 and New America stocks and TC2007 to find potential rocket stocks; Market rally begins
  • The new 3x ETF’s–triple your pleasure — or pain
  • 6th day of $QQQ short term down-trend; GMI could signal a Buy
  • In the hospital. Will resume posting next week. Thank you for your patience.
  • How I use put options as investment insurance
  • My first YouTube Vlog (video blog) Post: Sell in May and Go Away?
  • So, Wishing Wealth Reader, Tell Us About Yourself…
  • Blog post: David, my co-presenter, brilliant colleague of 20+ years died in a freak accident on 2/18; Day 35 of $QQQ short term down-trend; 15 promising stocks to monitor
  • Blog: Day 2 of new $QQQ short term down-trend; A lot of key stocks are technically weak. Look at daily Guppy chart since June. Will stocks resume up-trend with 2nd Quarter earnings?
  • Blog: Day 7 of $QQQ short term up-trend, it may end Wednesday, but longer term trend remains up, see chart.
  • Blog: Day 6 of $QQQ short term up-trend; GMI= 6 (of 6). Market remains in short and longer term uptrends.
  • Blog: Day 1 of new $QQQ short term up-trend; All GMI components are positive. Short and longer term trends are up. But Mag7 stocks are weak, see daily Guppy chart of MAGS.
  • Blog: Day 43 of $QQQ short term up-trend, it could end on Wednesday; Longer term up-trend remains, see weekly chart. QQQ has found support at its rising 10 week average, but is below its 4 week. Note how long it held its rising 4 week average, quite a rally.

Blogroll

  • Barchart All-Time Highs
  • Blue Collar Investor
  • CNNMoney: Pre-market Futures
  • Dark Liquidity
  • Seeking Alpha
  • Stock Chartist

Recommended Reading

QQQ and TQQQ ETF Profit Machine Momentum Masters - A Roundtable Interview with Super Traders - Minervini, Ryan, Zanger & Ritchie II Alan Ellman's Selling Cash-Secured Puts: Investing to Generate Monthly Cash Flow Stock Investing For Students - a plan to get rich slowly and retire young Trade Like a Stock Market Wizard: How to Achieve Super Performance in Stocks in Any Market Exit Strategies for Covered Call Writing: Making the Most Money When Selling Stock Options Complete Encyclopedia for Covered Call Writing Wall Street The Other Las Vegas How to Make Money in Stocks: A Winning System in Good Times and Bad, Fourth Edition Trend Trading: A seven step approach to success How Legendary Traders Made Millions: Profiting From the Investment Strategies of the Gretest Traders of All time The Complete TurtleTrader: The Legend, the Lessons, the Results How to Make Money Selling Stocks Short Reminiscences of a Stock Operator Stan Weinstein's Secrets For Profiting in Bull and Bear Markets Lessons from the Greatest Stock Traders of All Time How I Made $2,000,000 In The Stock Market

Archives

© 2026 WishingWealthBlog.com

Loading Comments...