Stock Market Technical Indicators & Analysis
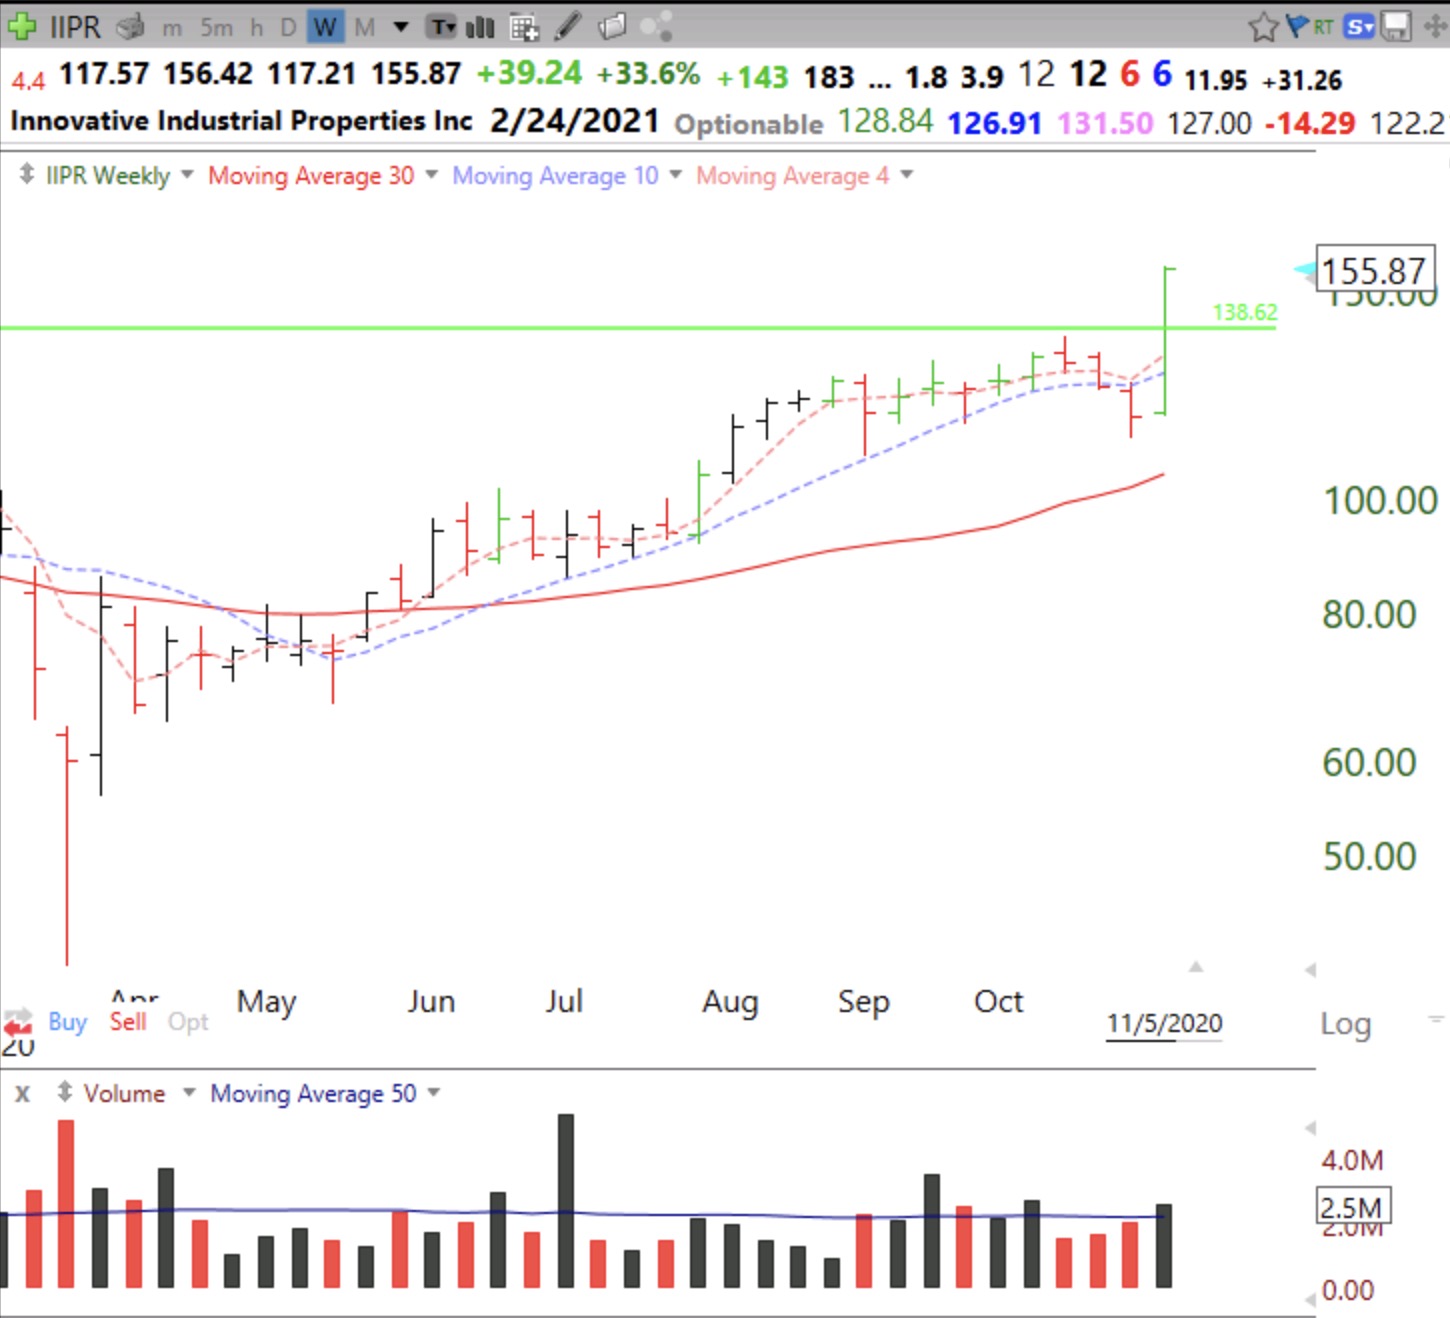
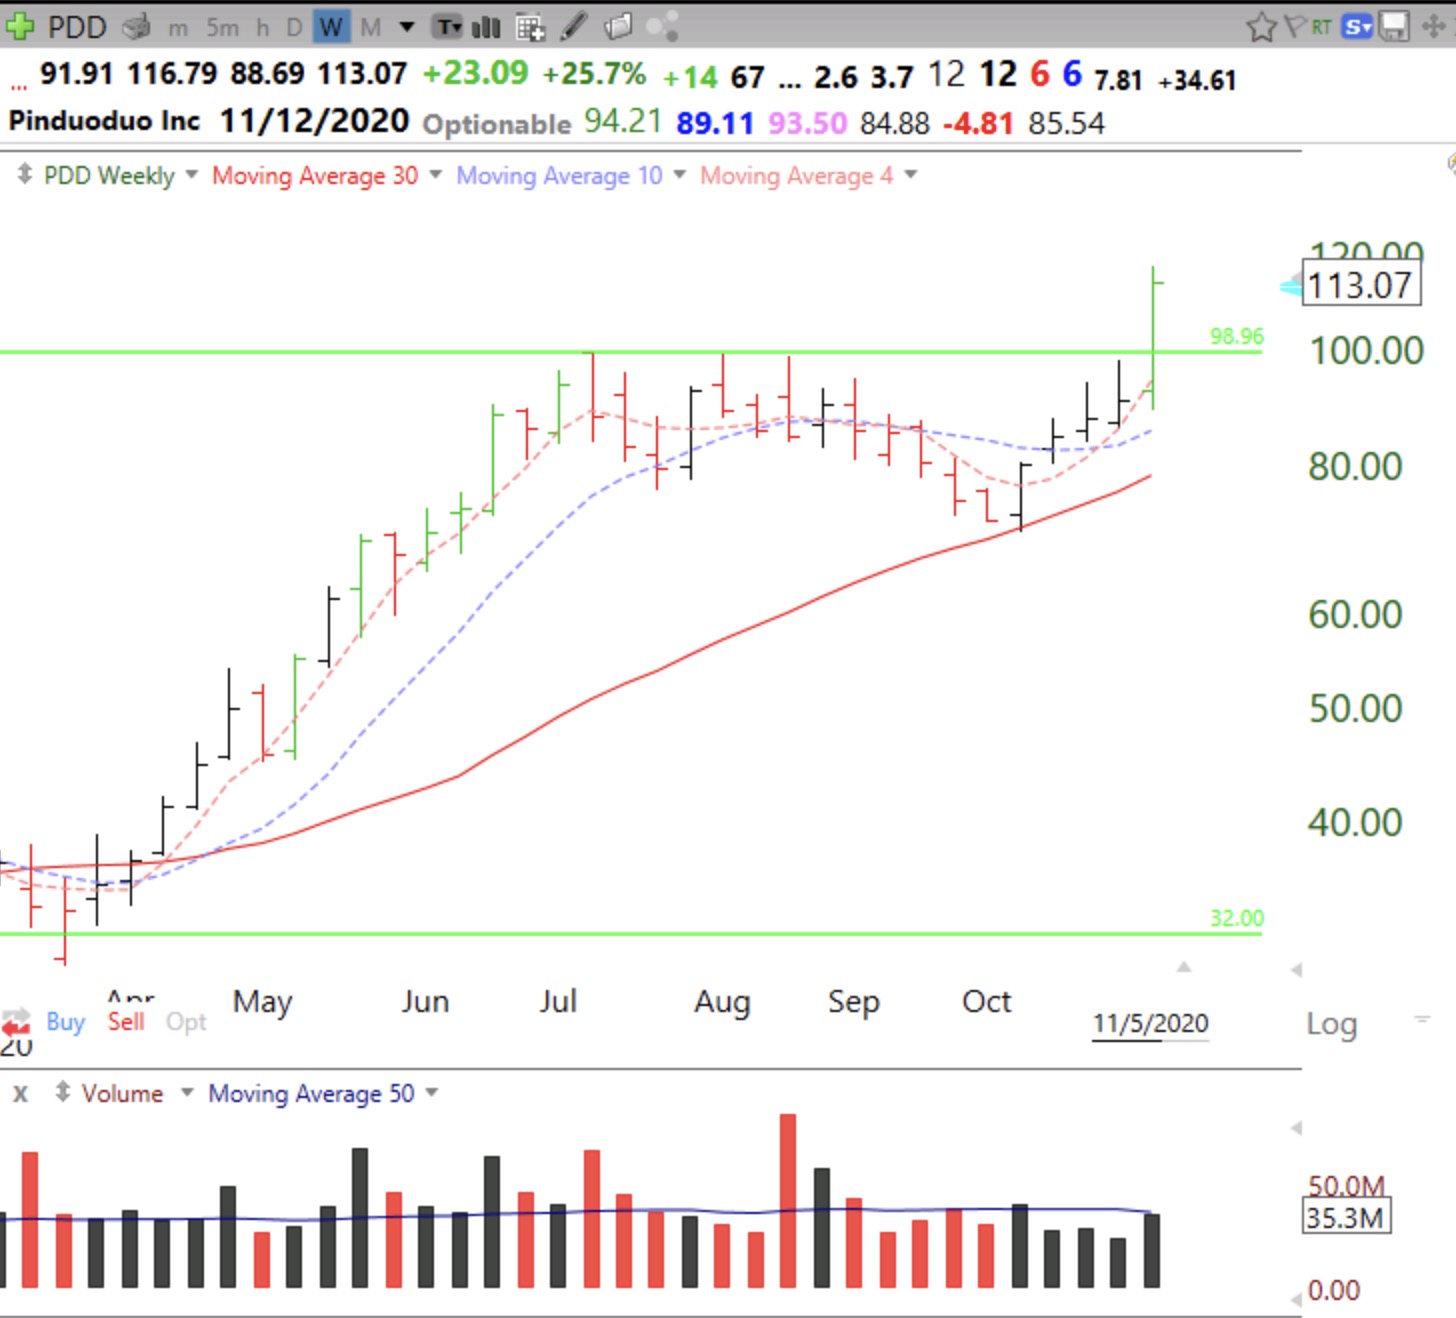
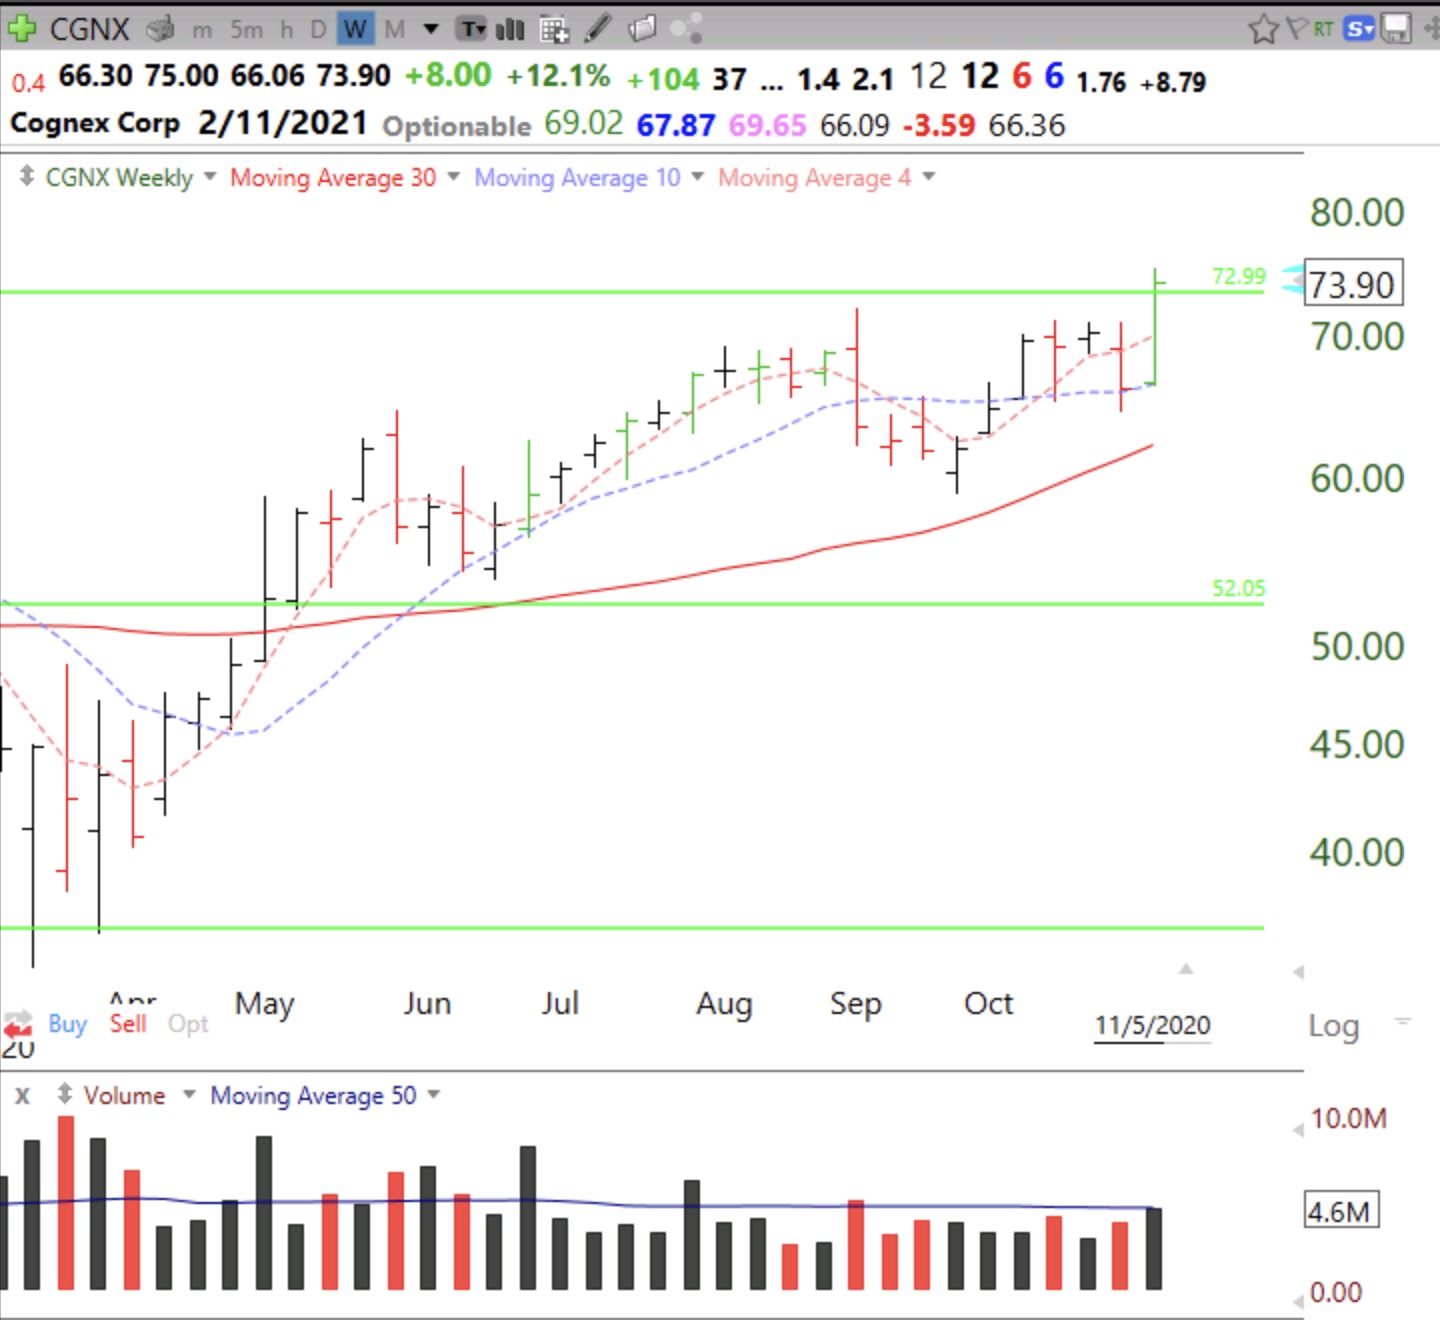
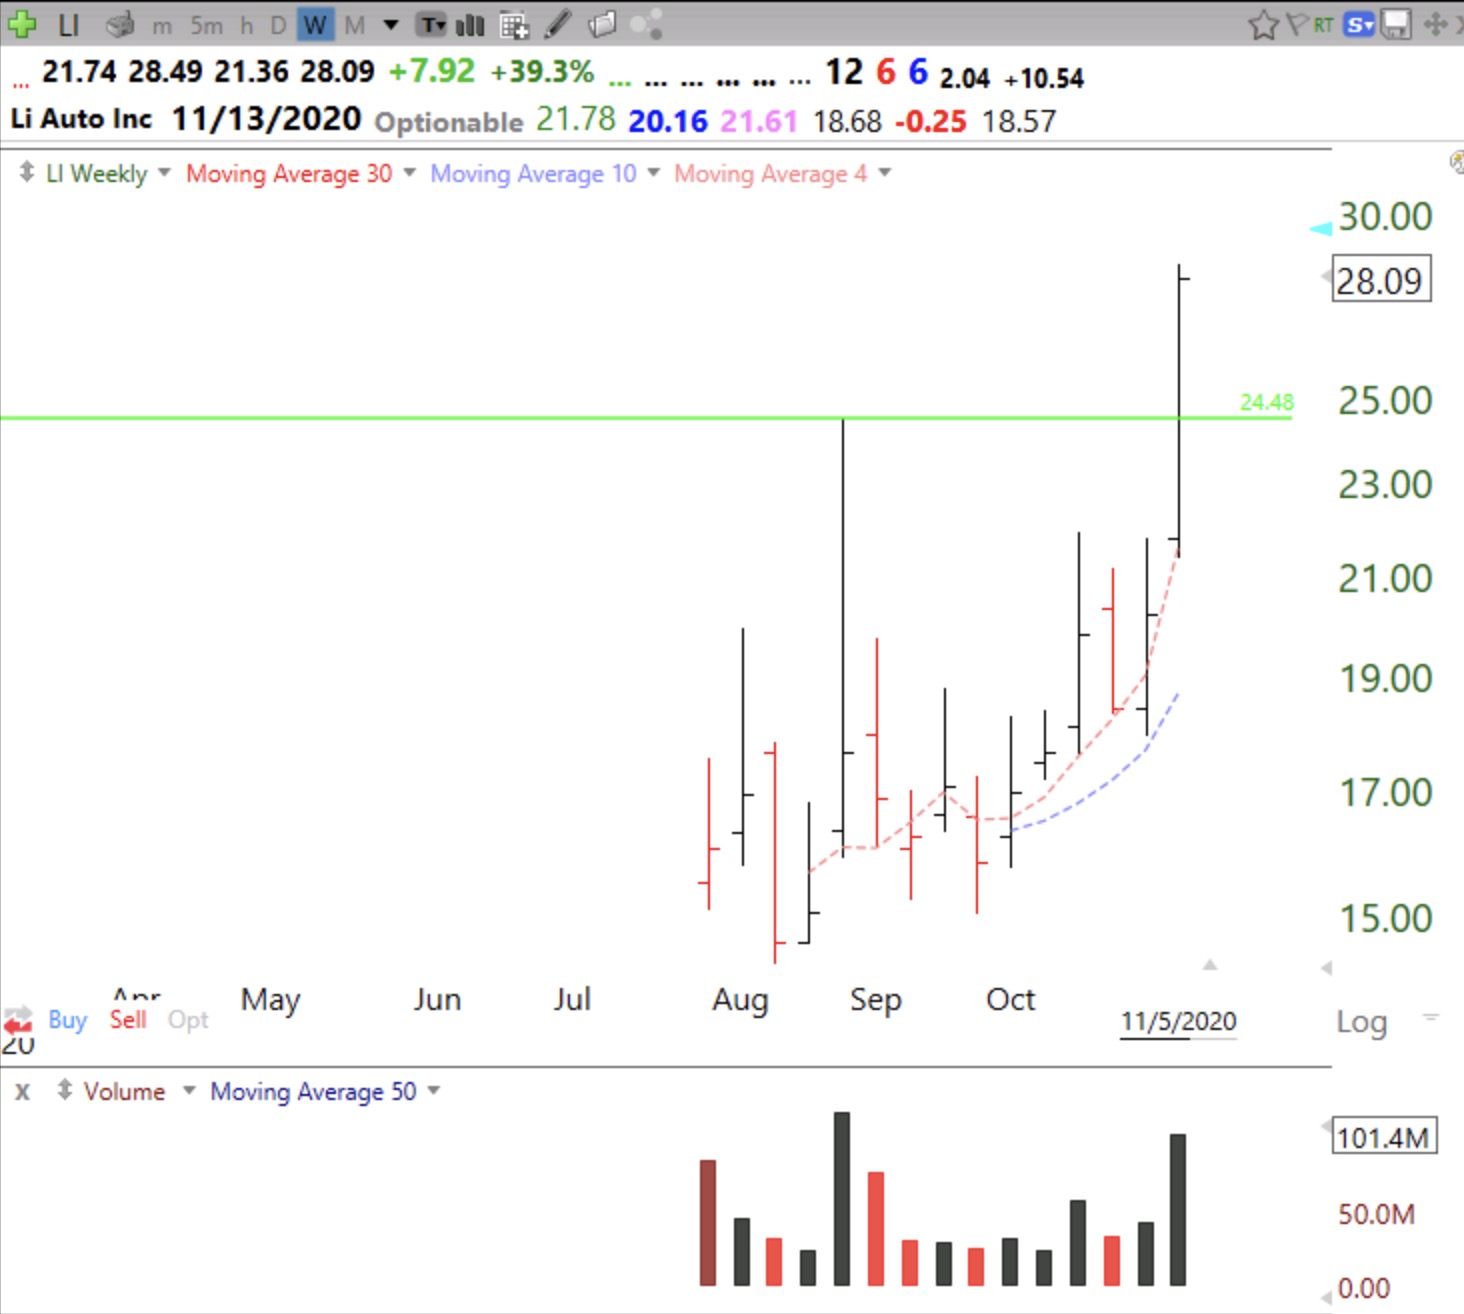
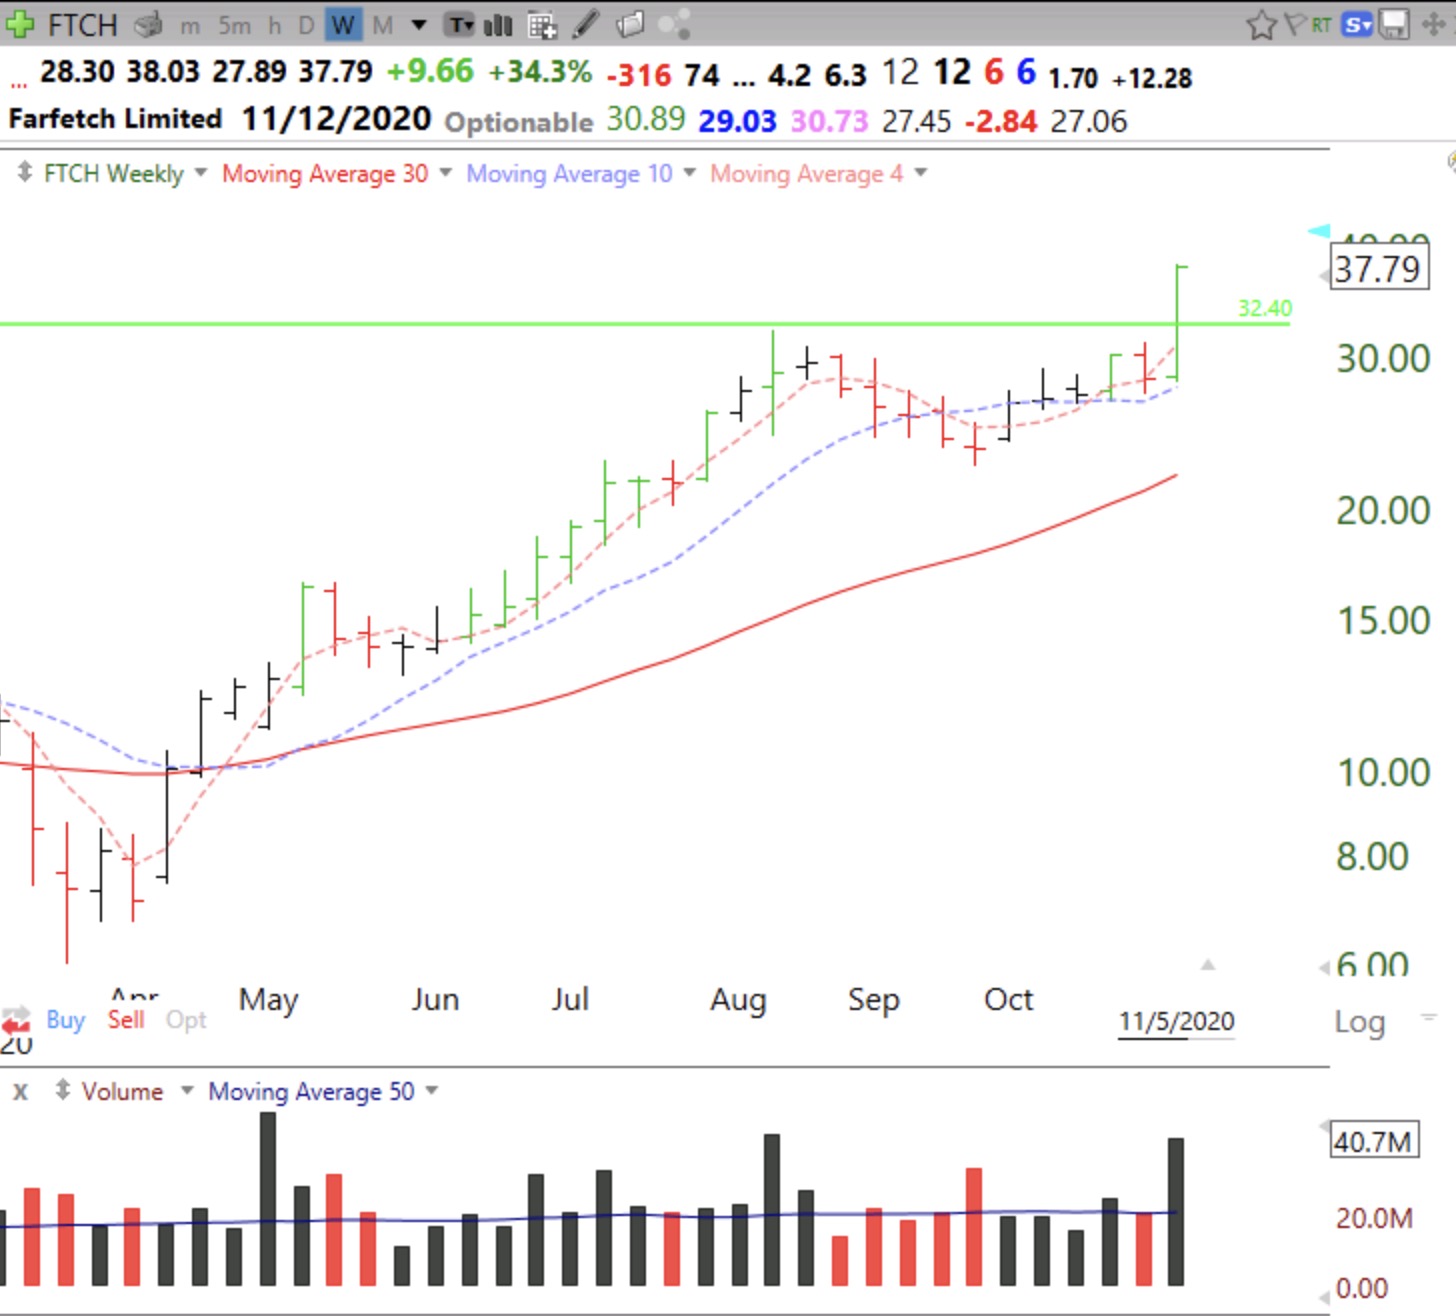
Some weekly charts of stocks having a GLB to an ATH this week. Volume total for the week is based on first 4 days and will be much higher by close on Friday. Many of these came up intraday on alerts I had set on TC2000.