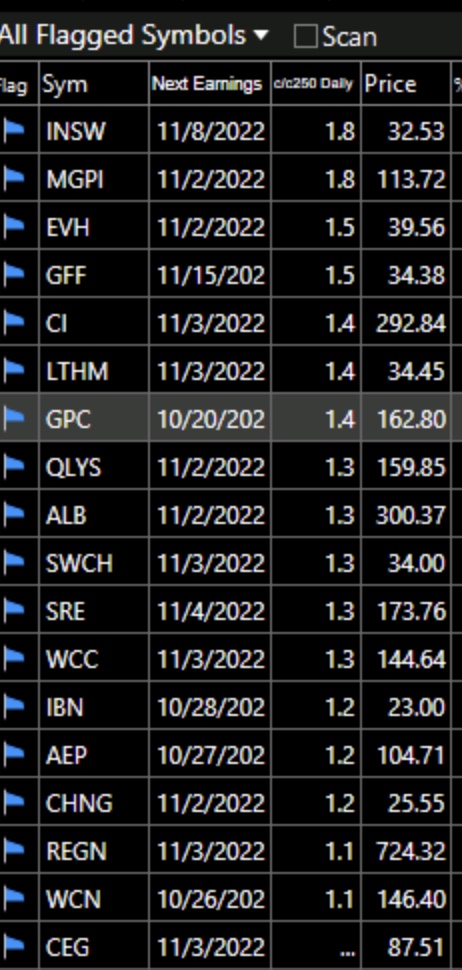
Here are the 18 stocks on my IBD/MS watchlist that reached ATHs on Friday. They are sorted by Friday’s close/close 250 days ago. None of them have doubled. CEG has, but it is a recent IPO and did not trade 250 days ago. Any TMLs (true market leaders) among them?
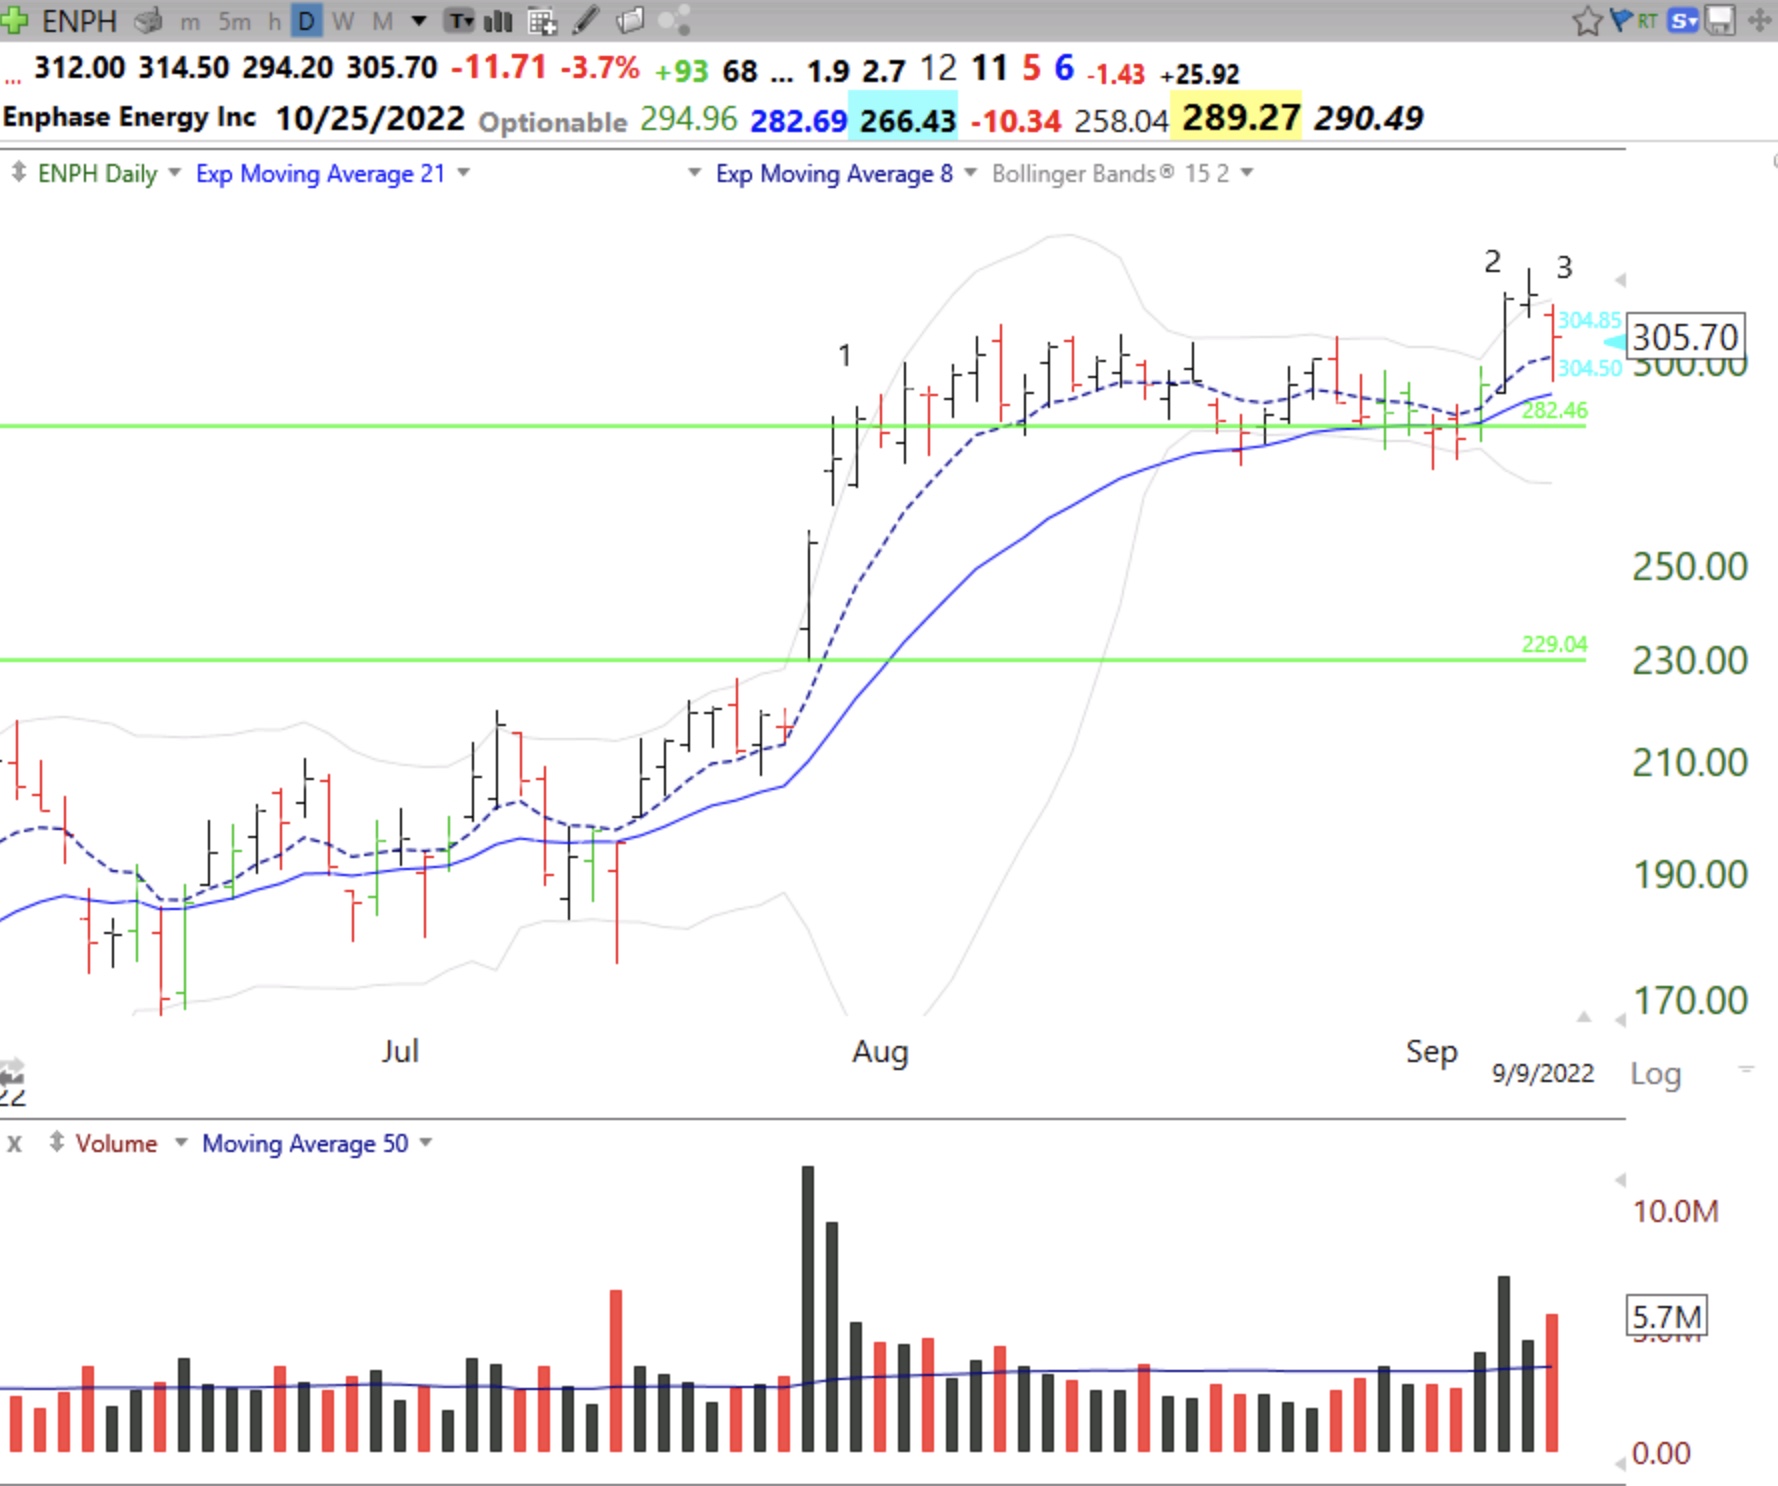
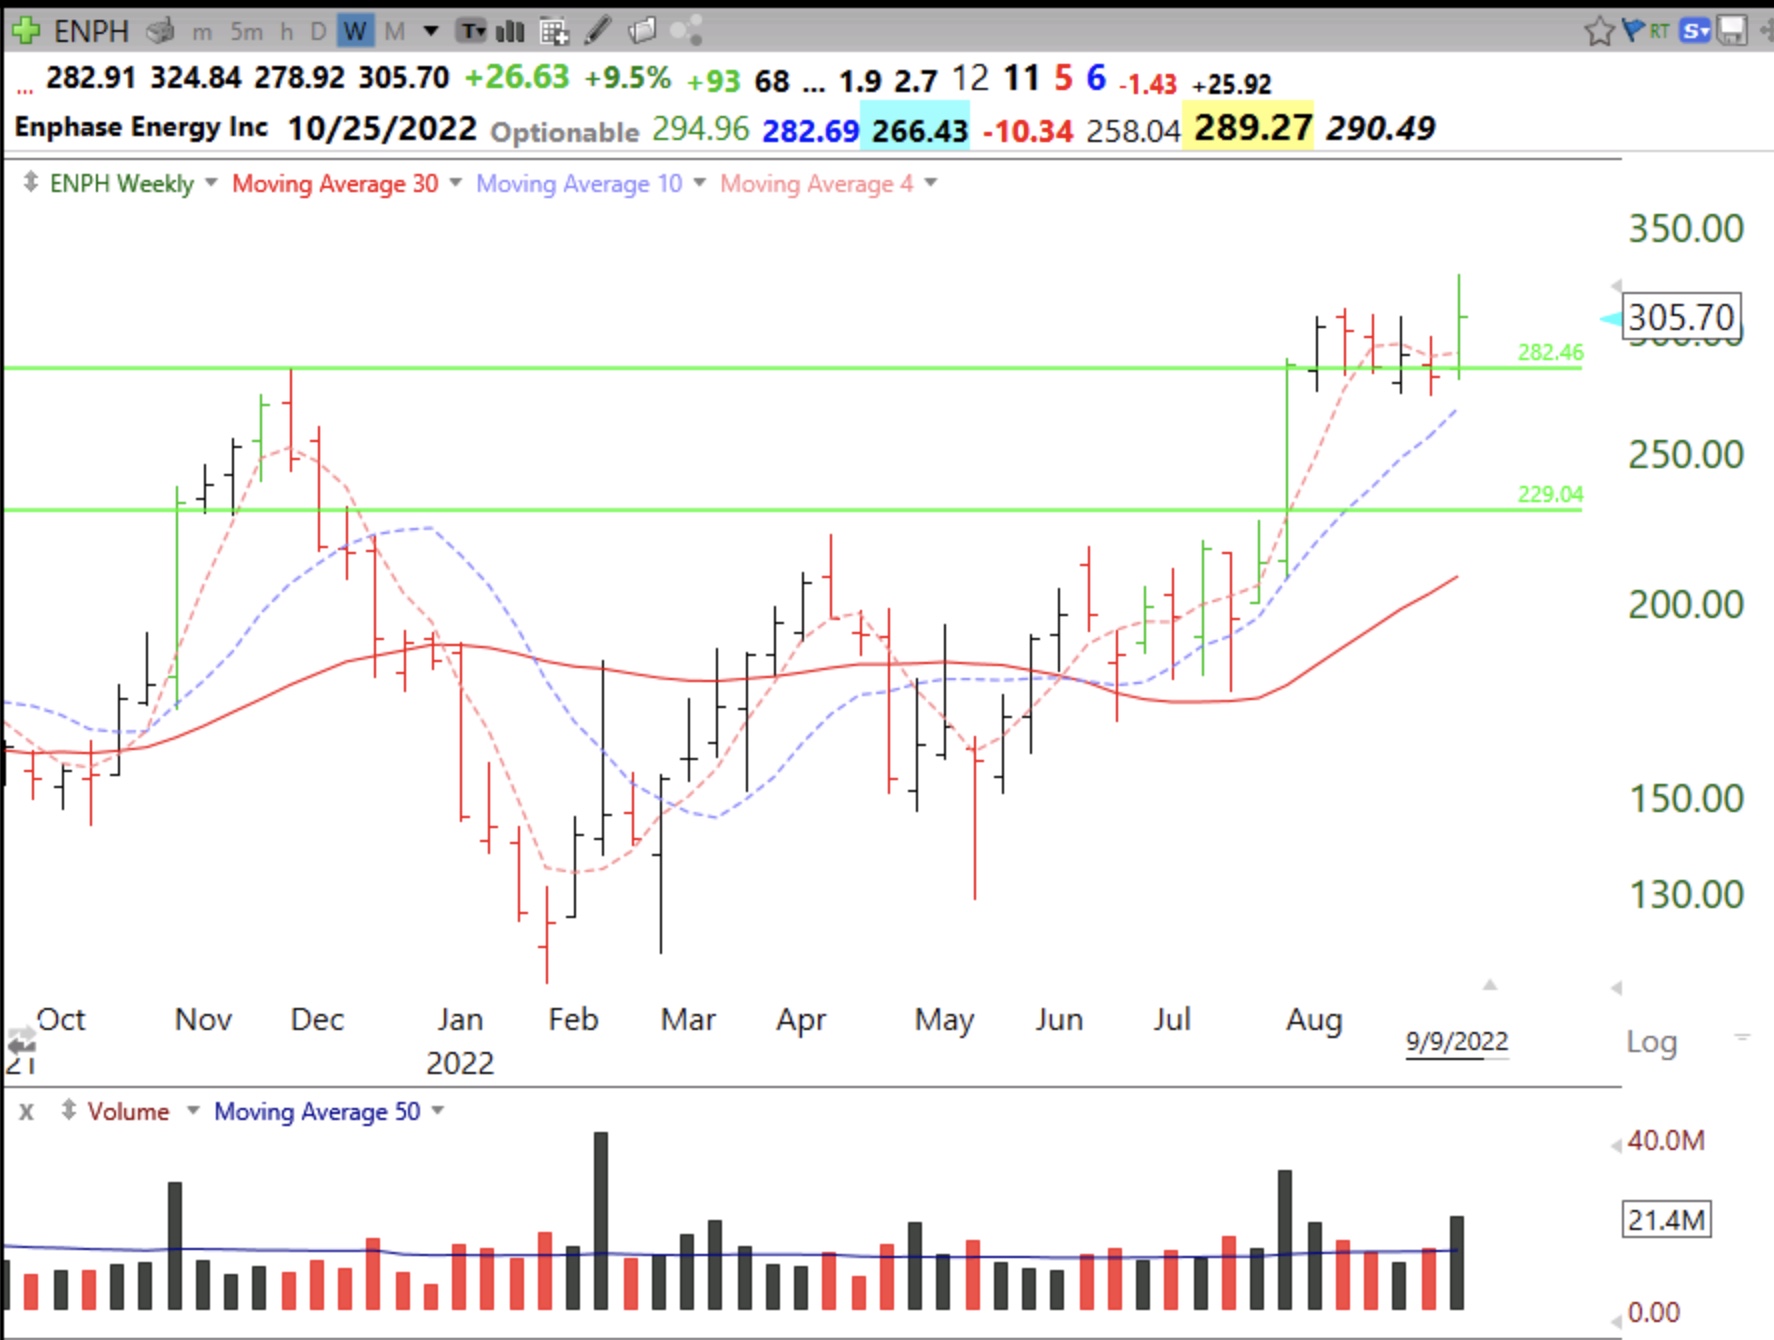
ENPH is an example of a promising stock that encountered volatility last week. After having a high volume post earnings release GLB in late July (1), ENPH went sideways along its green line for weeks. Then last Wednesday it had an above average rise to a new ATH. It closed that day above its upper 15.2 daily Bollinger band (2). This is usually an extended position, except on a break-out. On Thursday it closed again above its upper BB. On Friday, however, it had an above average volume decline and actually traded intraday below its 8 day exponential moving average (purple dotted line). But it closed the day above that average (3). A close below that average would be one initial sign of technical weakness. If I owned it I would consider the GLB to have failed if ENPH closed back below its green line (282.46). If I purchased it based on the GLB set-up, I would then have to sell out until it closes back above the green line.
On the other hand, I always want to check a weekly chart before selling. This weekly chart of ENPH looks quite strong, with the 4wk avg>10wk avg>30 wk avg. And it closed up last week on higher volume. For a longer swing trade I would not sell until ENPH closes the week below its 10 week average (purple dotted line, at 266.43). The fact that last week was also a weekly green bar is a plus. A weekly green bar is drawn when the 4wk>10wk>30wk avg and the current bar bounces up off of the rising 4wk average and closes the week above it.
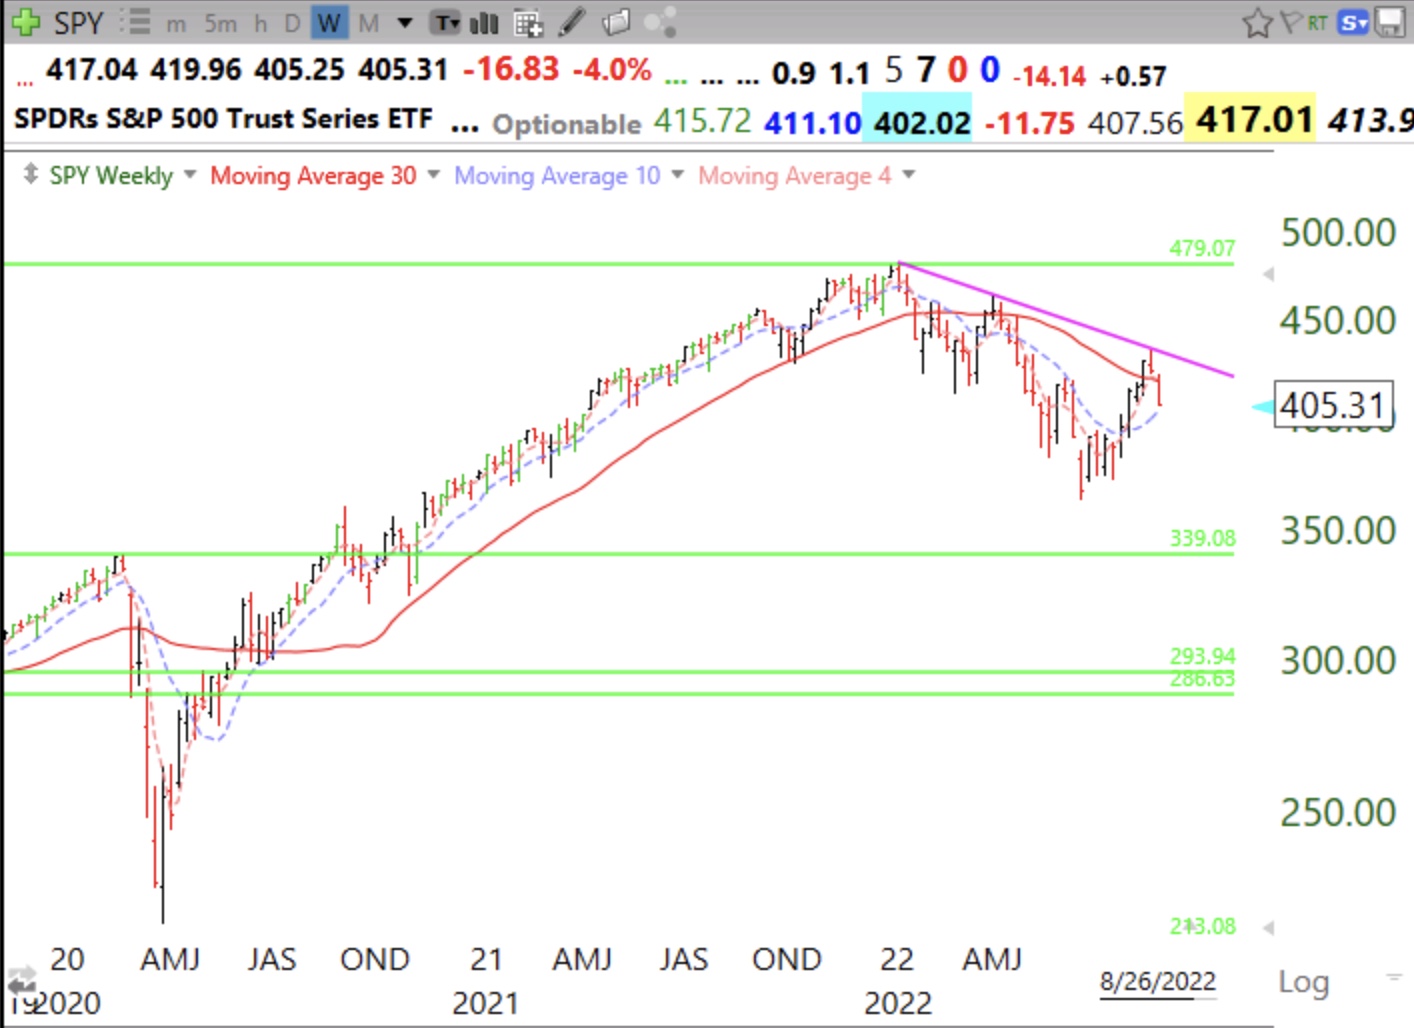
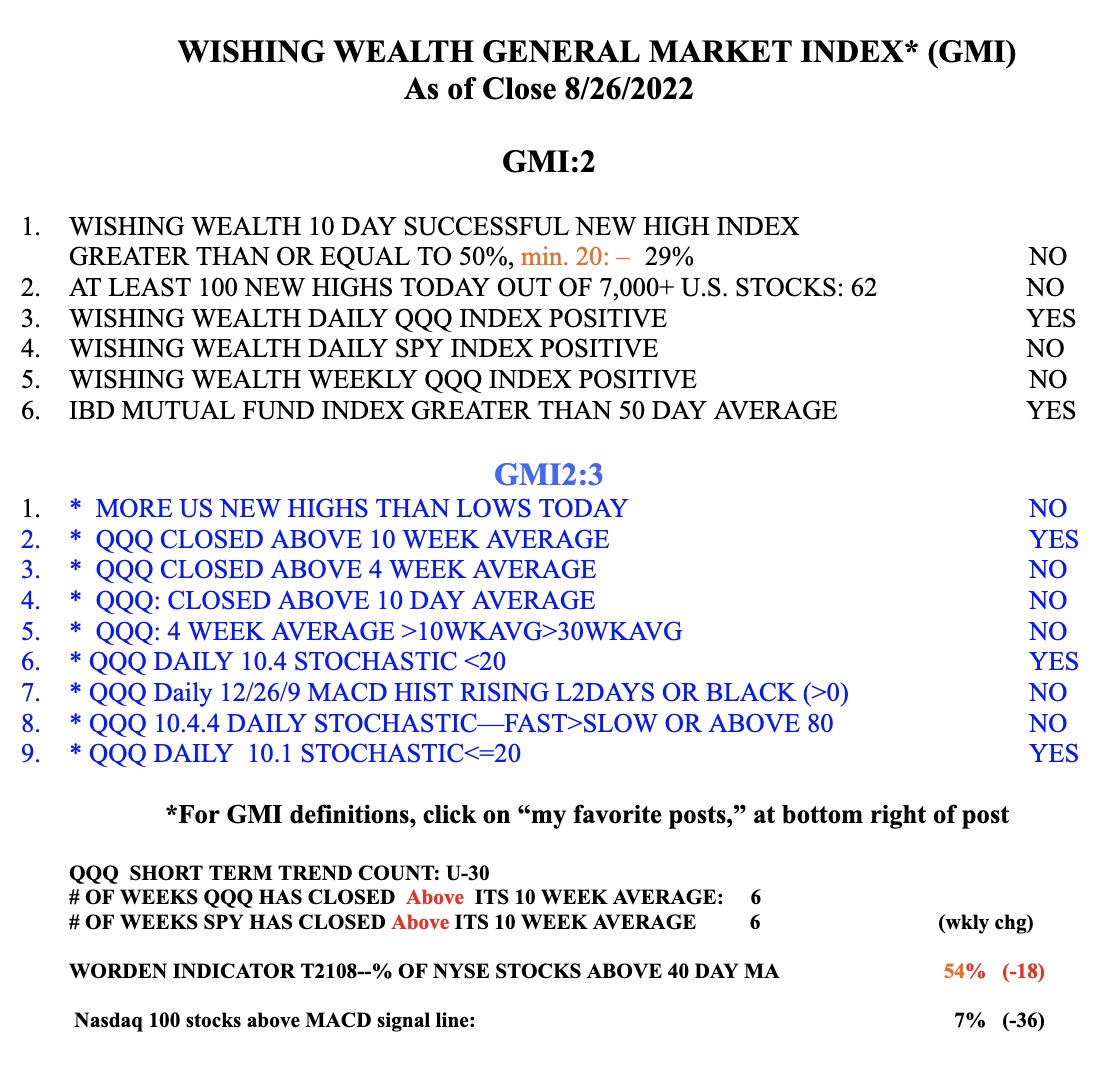
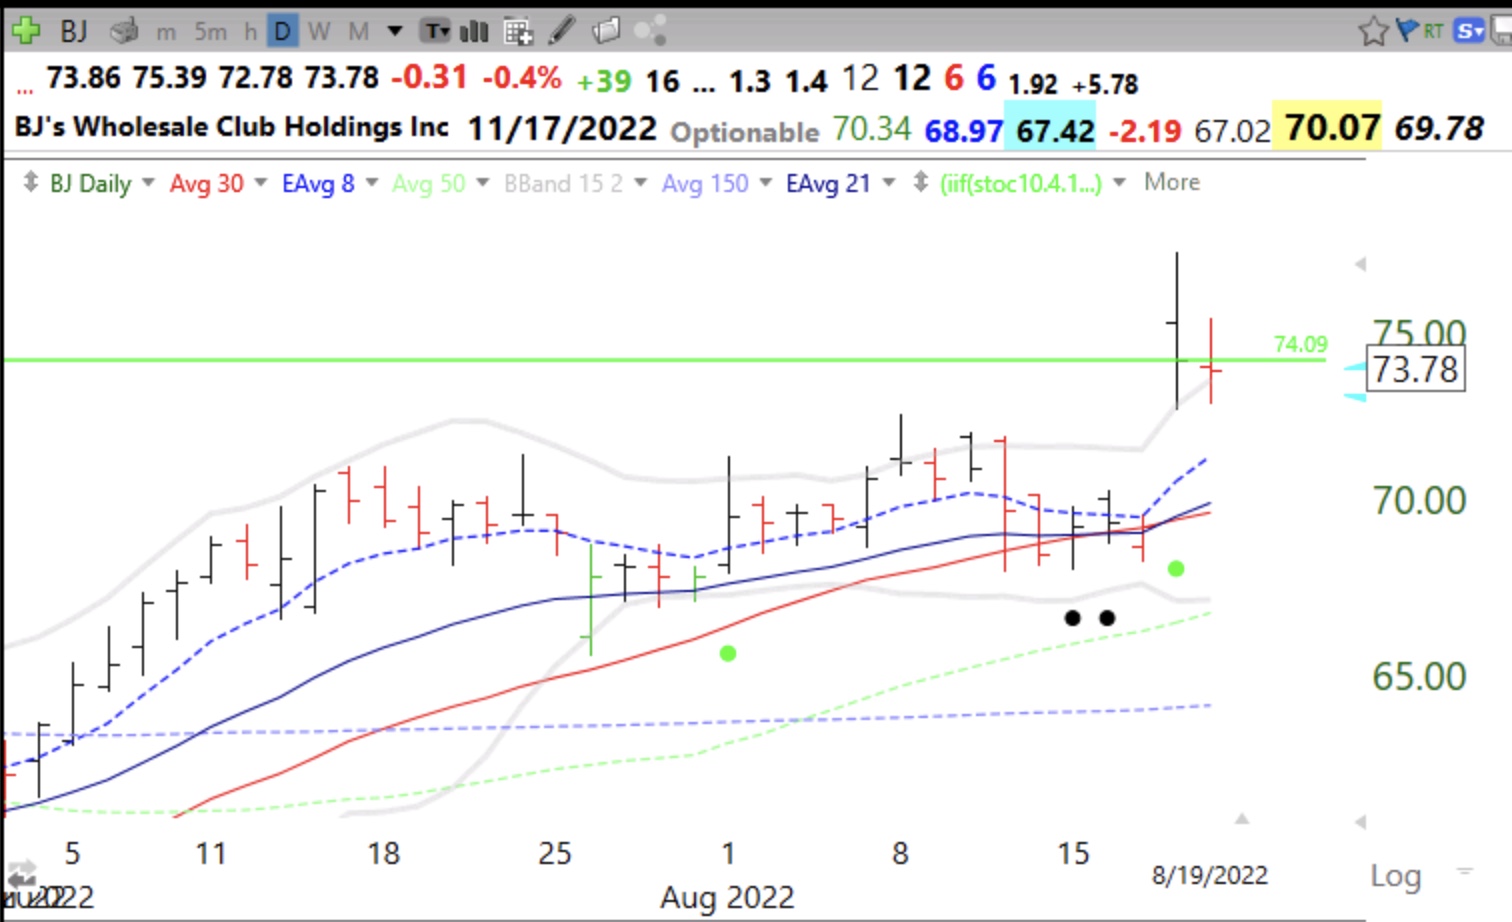
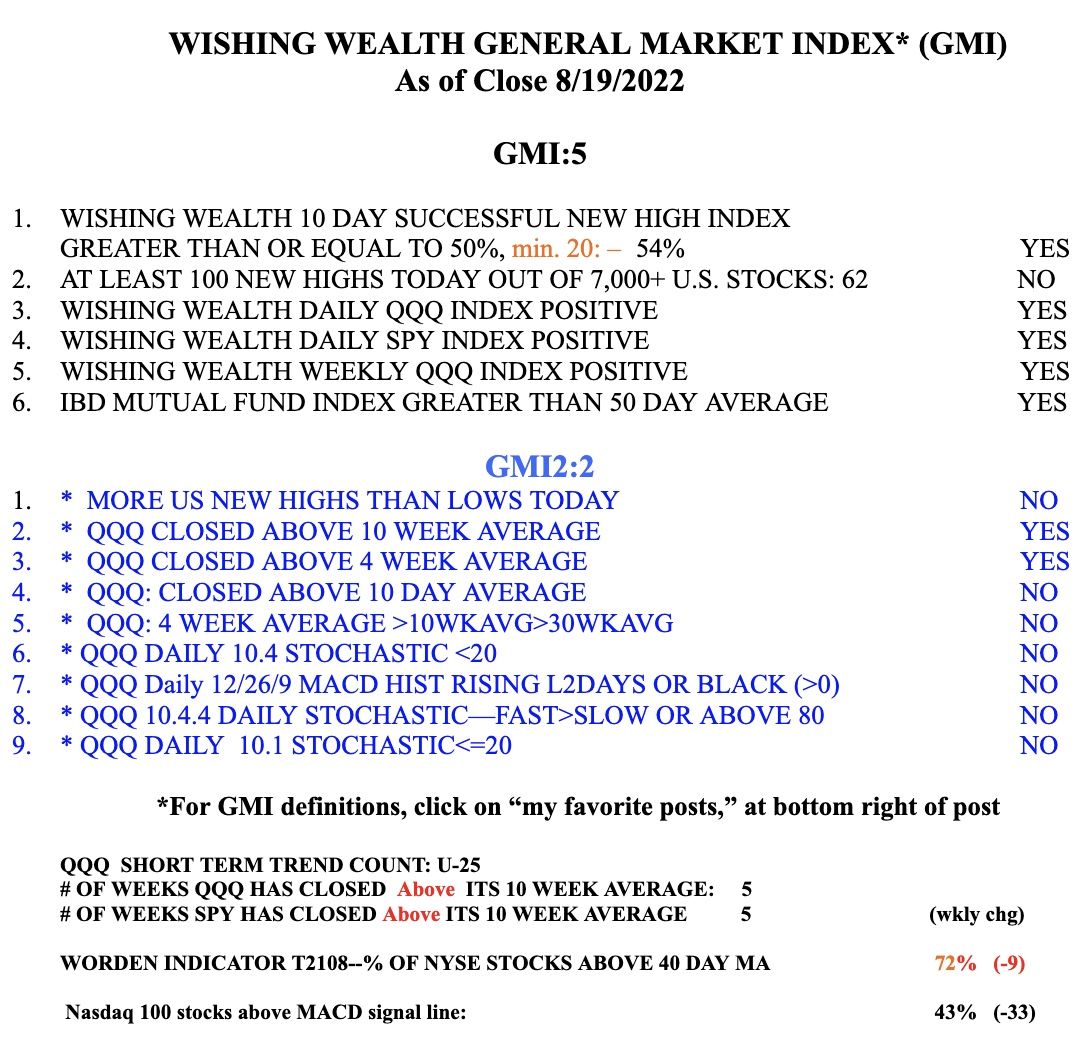
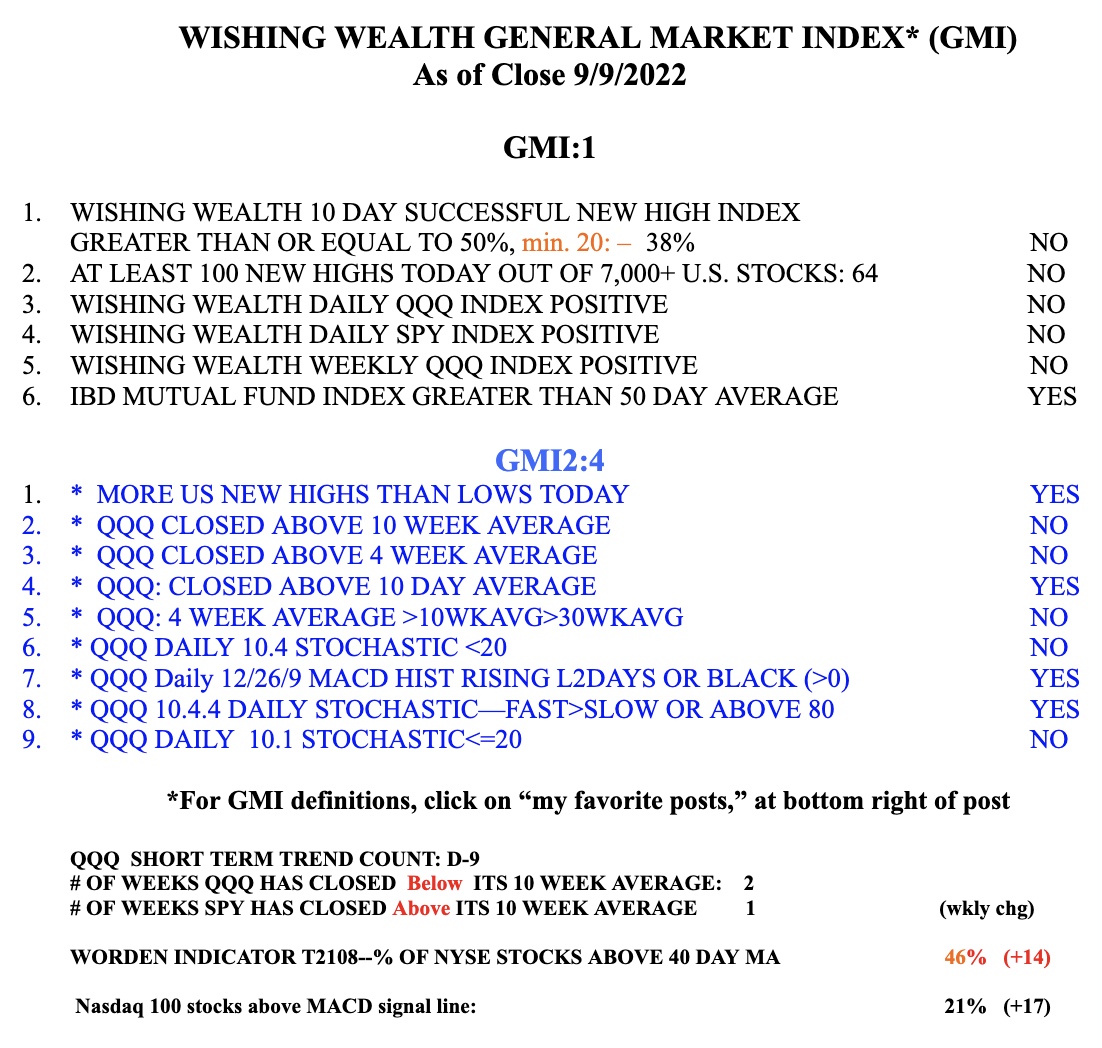
Meanwhile the GMI remains RED but gained a point Friday as the IBD growth mutual fund index retook its 50 day average. I also noted below that SPY has closed back above its 10 week average, a sign of strength. But the market remains in a Stage 4 down-trend.
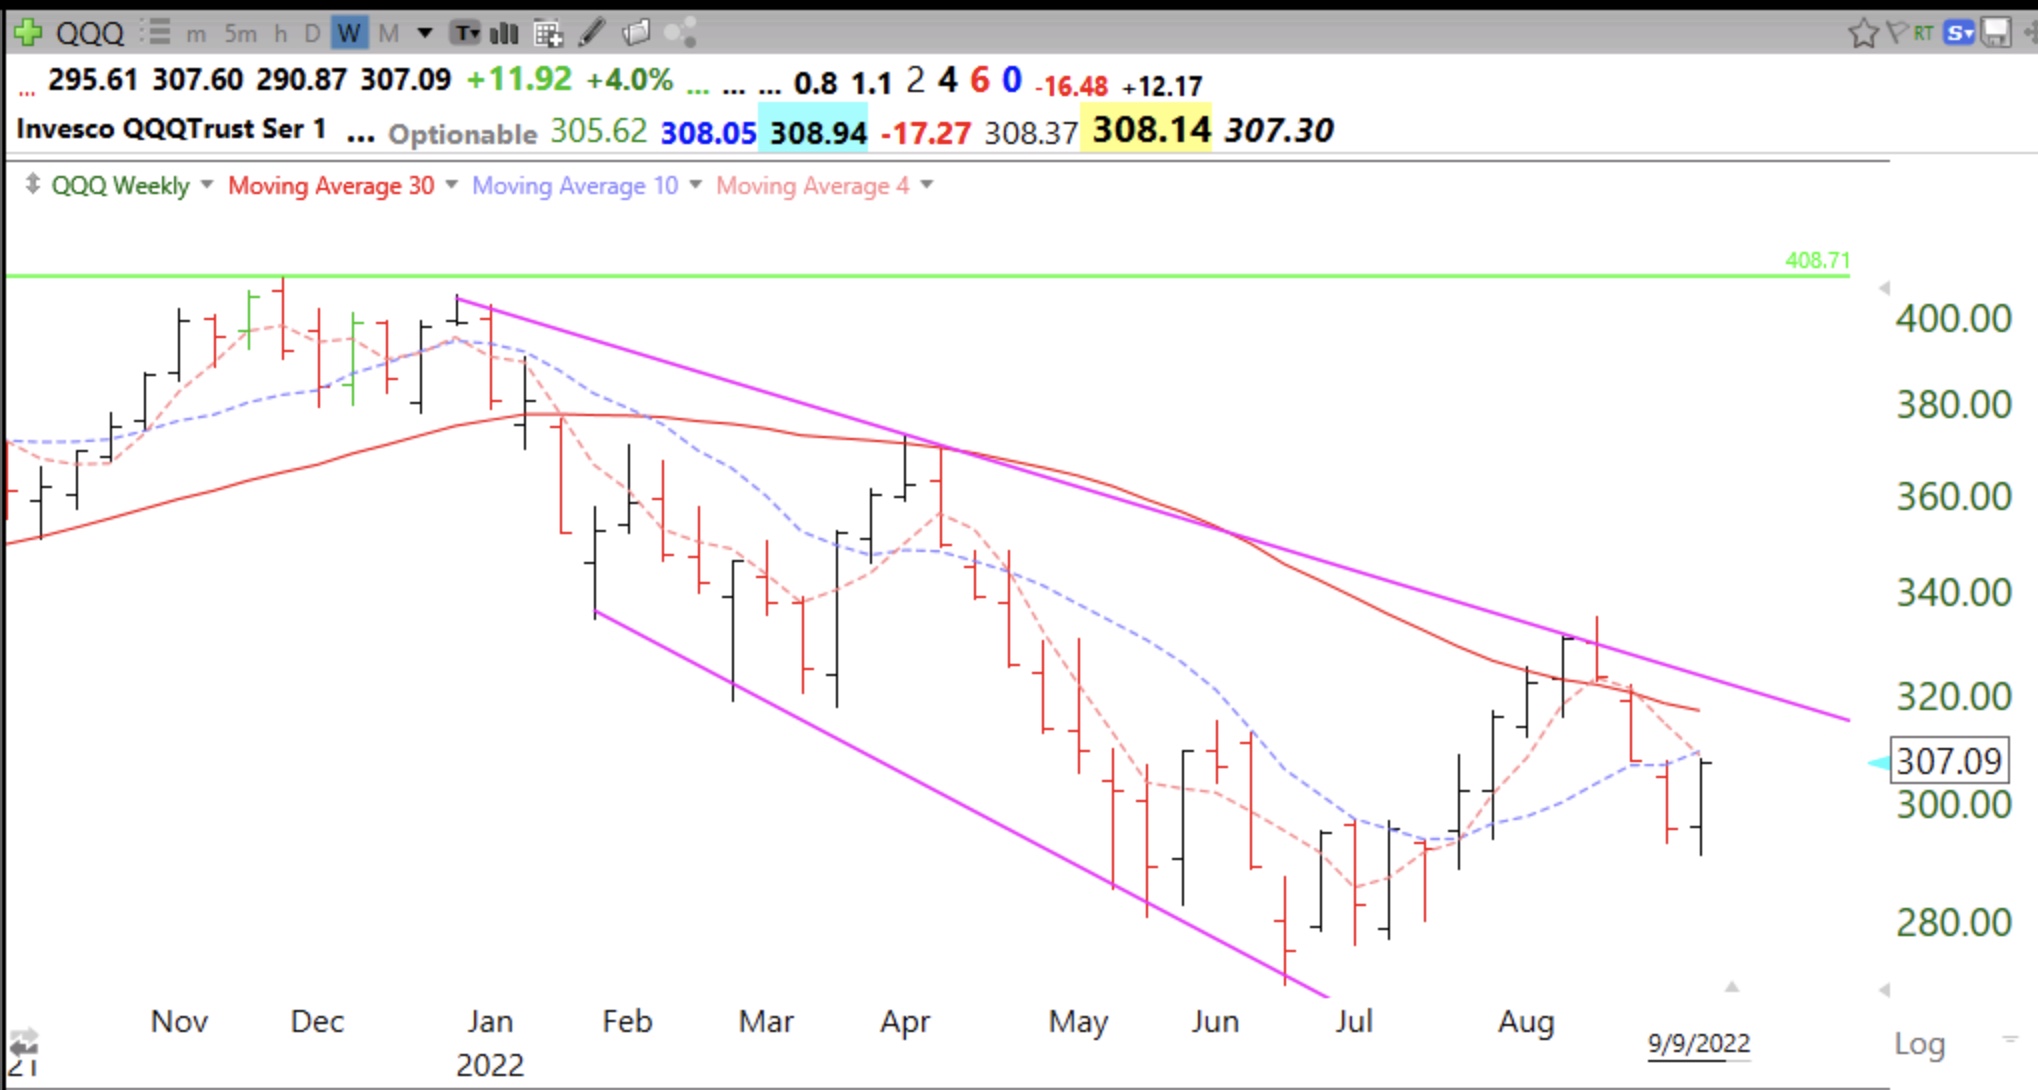
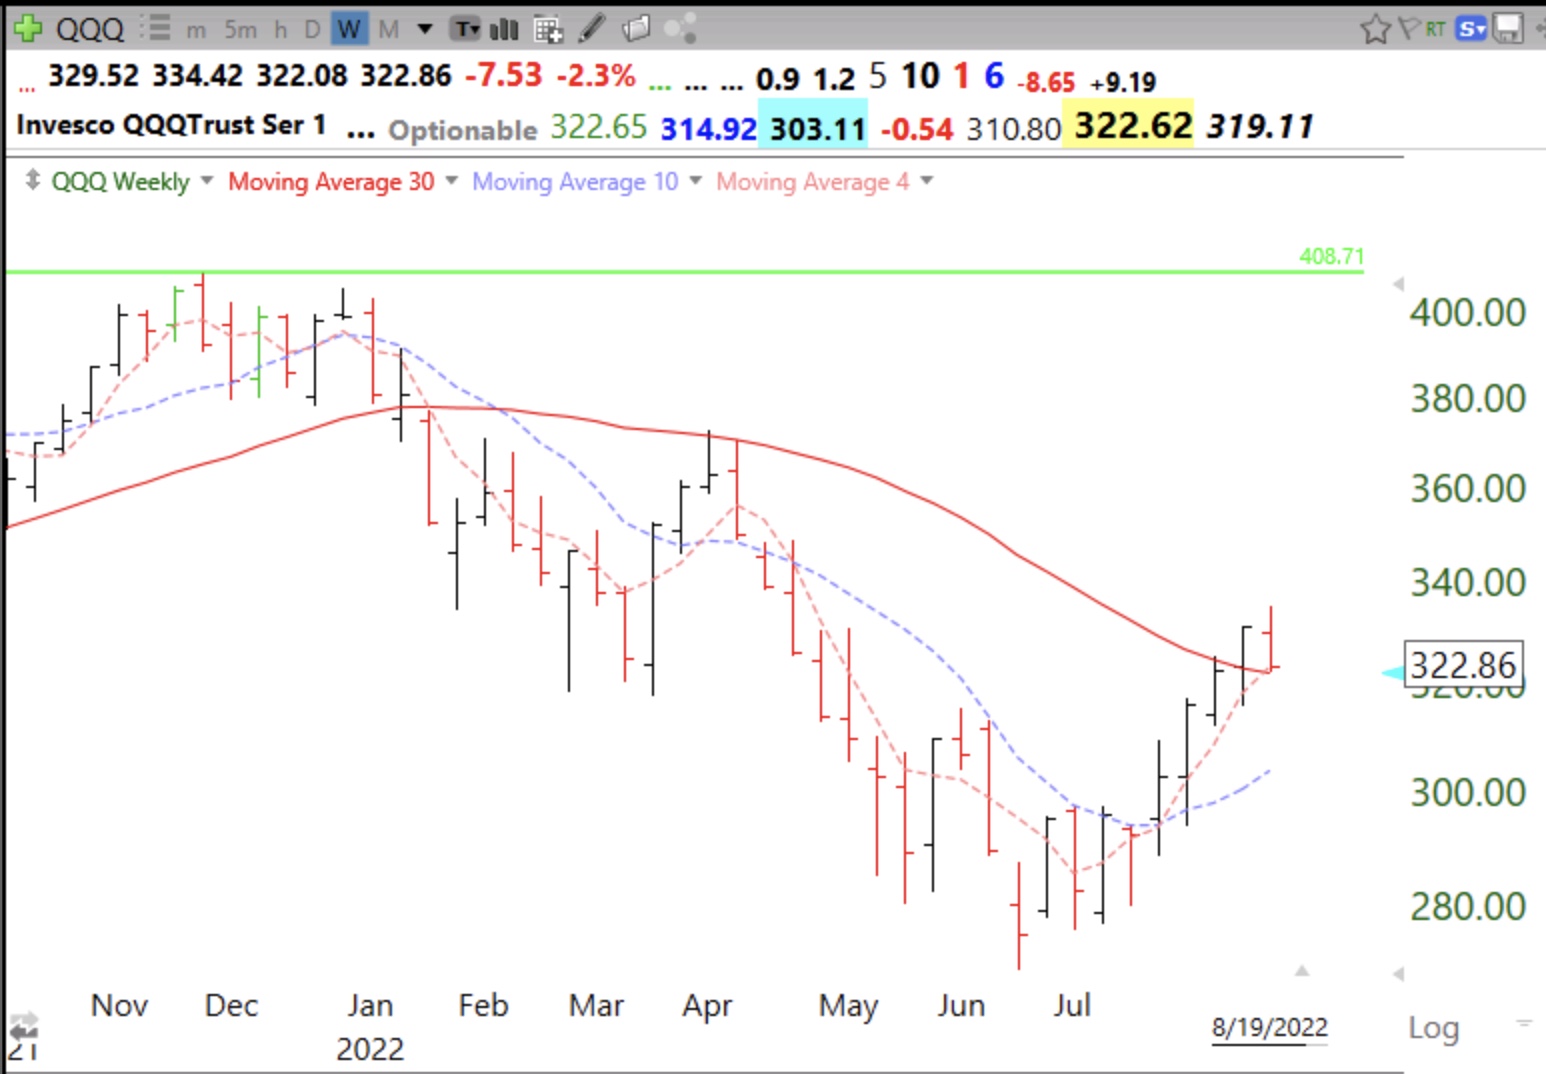
Last week QQQ rallied back to just below its 4 week average (red dotted line). A close this week below the 4wk avg would be a sign of major weakness to me. Be careful!