IMAX had a green line break-out to an all-time high on Monday. I bought some. Note the high volume spikes on up-days (black spikes).
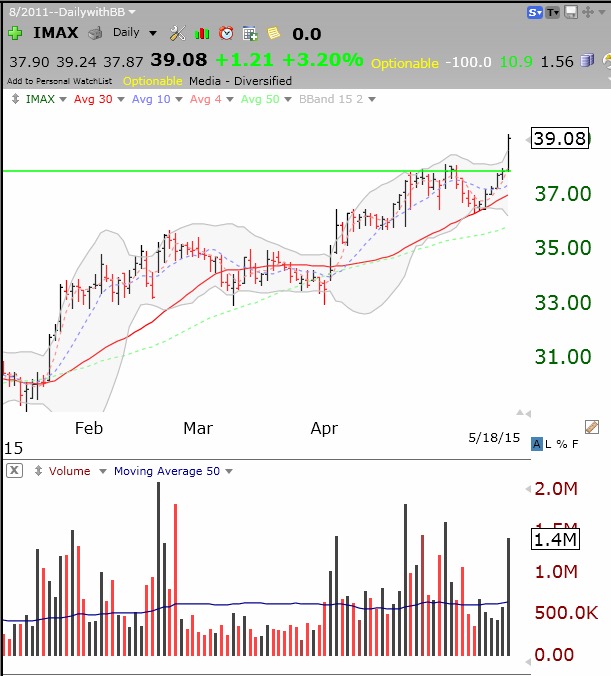
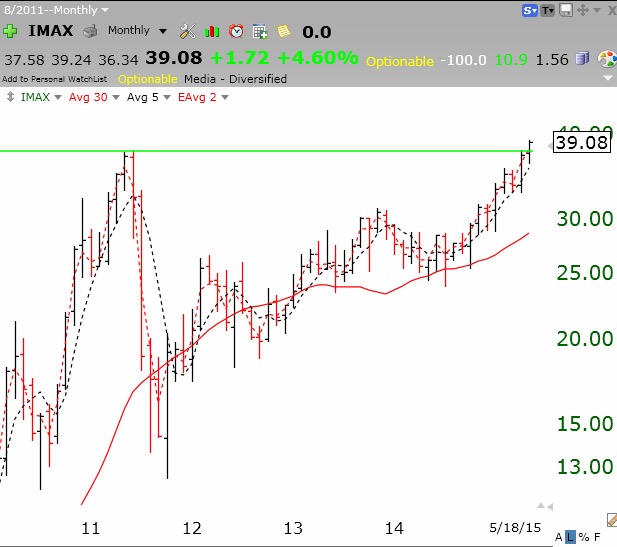
The green line was drawn at the all-time high reached in 2011.
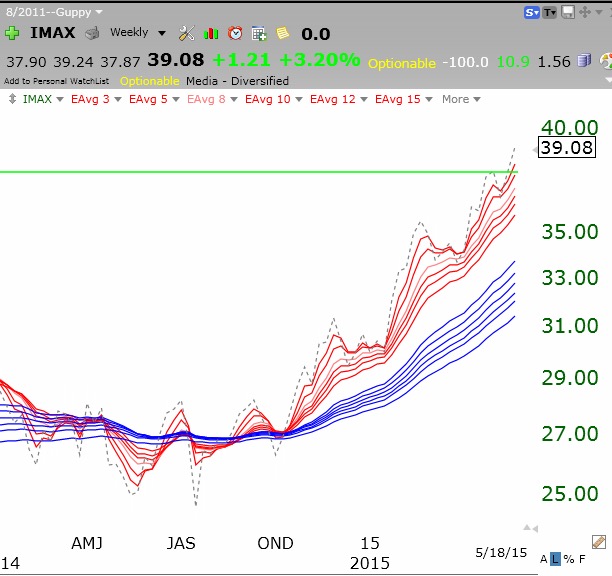
 IMAX is in a nice RWB up-trend.
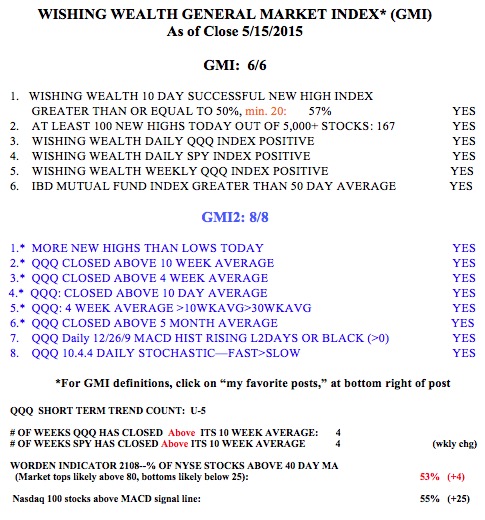
Stock Market Technical Indicators & Analysis
IMAX had a green line break-out to an all-time high on Monday. I bought some. Note the high volume spikes on up-days (black spikes).
The green line was drawn at the all-time high reached in 2011.
IMAX is in a nice RWB up-trend.
All of my GMI and GMI-2 indicators are positive. This market acts like it wants to continue the longer term up-trend.
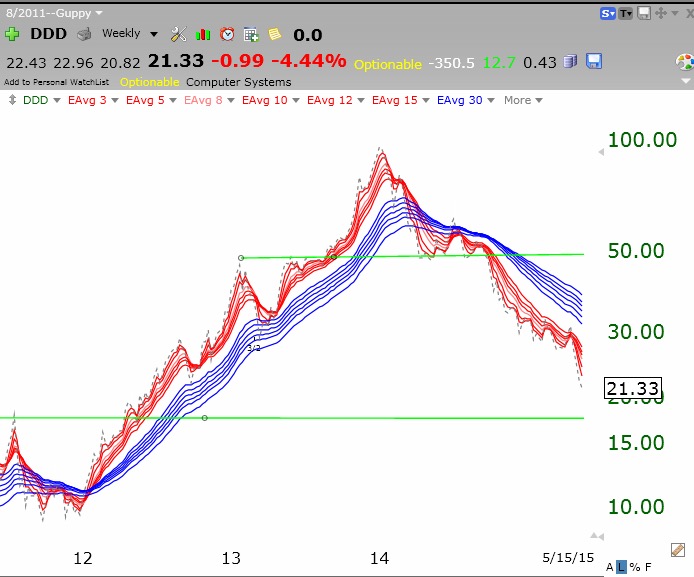
 I thought you might like to see the value of the GMMA for tracking the life cycle of a growth stock. DDD remained in an RWB up-trend for most of the period from 2012-2013. In May of 2014 the RWB pattern ended and changed into a bearish BWR pattern. Every stock, ETF and mutual fund owner should draw the GMMA chart and see whether the pattern is RWB or BWR.
 SSYS, another 3D printing stock showed a similar pattern. Note the Head and Shoulders top (S/H/S) which I identified long ago.
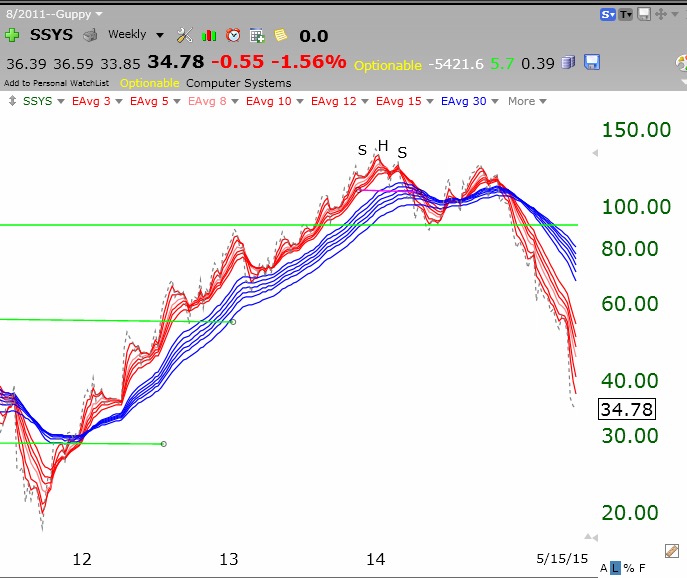 I only hold stocks in a bullish RWB pattern. Ride the trend…..
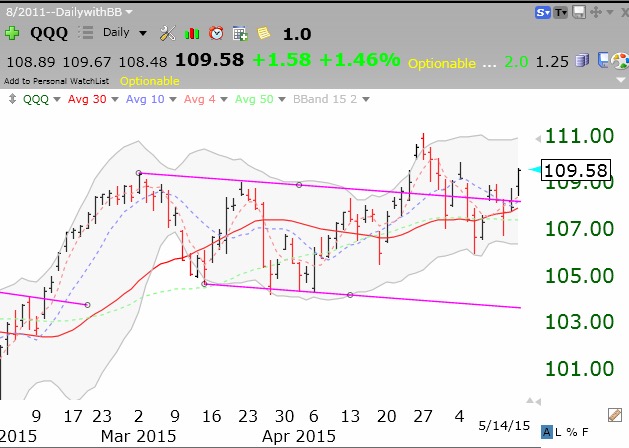
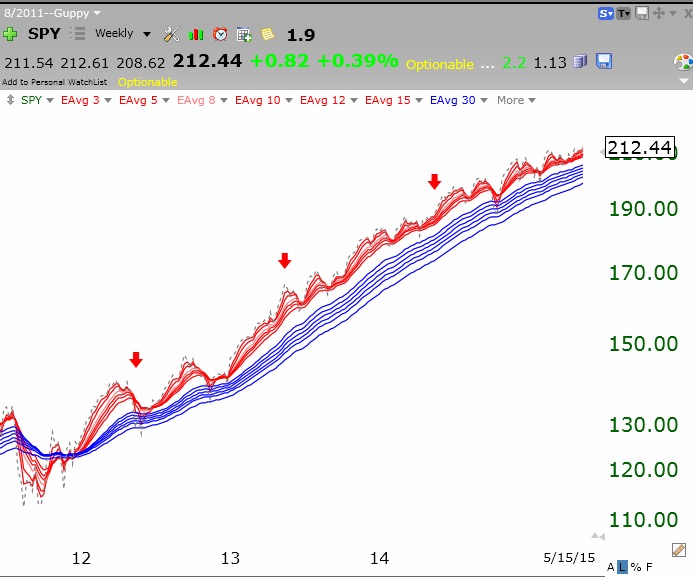
By the way, look at the strong RWB pattern in the SPY (and DIA and QQQ). The media world is filled with hysterical “chicken littles” screaming that the sky is falling….
All GMI components are positive. IBD sees market back in confirmed up-trend. QQQ looks strong.