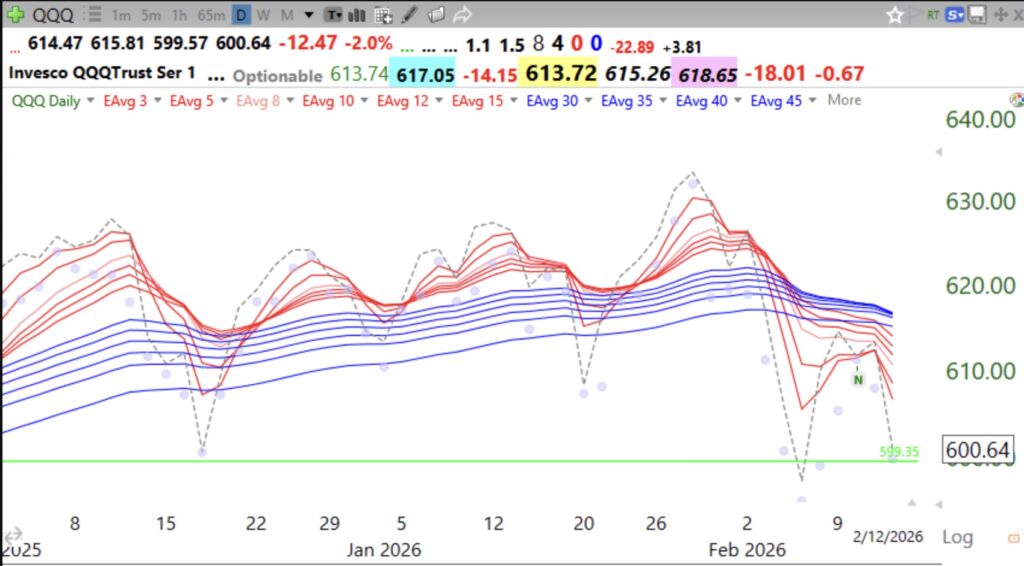
Blog post: Day 23 of $QQQ short term up-trend but GMI falls to 2 and could flash RED on Monday; Has $DIA formed a double top?, see weekly chart.

GMI2/6
GMI-23/9
T210839%

The leaders are swooning and this is not the time for me to be brave and stay in long positions. There were only 11 US stocks trading at ATHs on Friday. So  purchasing stocks at ATHs is not for me. Also, DIA may be forming a double top. DIA has now closed below its 10 week average (blue dotted line). But it is still in a Stage 2 up-trend, until it trades below its 30 week average (red line). Time for me to be very careful–I am a chicken.

Screenshot

The GMI could flash red, with another day below 3 (of 6). When the GMI is red, it is very difficult for me to trade stocks profitably on the long side.

Screenshot

Blog Post: Day 21 of $QQQ short term up-trend; 127 US stocks at yearly highs, 46 at ATHs and 70 new lows; Recent IPO, $MRX, has doubled without ever forming a green line top! Check out its monthly and weekly charts

GMI5/6
GMI-27/9
T210850%

MRX has IBD comp=EPS=99 and RS=96. It never rested at least 3 months for me to be able to draw in a green line! It has already doubled in 11 months, as this monthly chart shows.

Screenshot

The weekly chart shows the typical pattern of a strong stock. Since August, it has closed mostly above its 4 wk average (pink dotted line) and its 4 wk average has closed above its 10 week average. These are the characteristics of a rising stock. Possible entries occur with a bounce up off of the 4wk or 10 wk avg (blue dotted line). The 10 wk avg is rising above the 30 wk avg (red line), indicating a Weinstein Stage 2 up-trend.

Screenshot


Blog Post: Day 19 of $QQQ short term up-trend, short and long term up-trends intact; What happened to $DAL after its GLB?

GMI5/6
GMI-27/9
T210849%

Last Wednesday I posted that DAL looked promising after it had an oversold bounce (blue dot).  Then on Thursday the stock tanked and traded below the green line. I would have been stopped out because the bounce failed. But DAL held the green line and rose on Friday. I have written many times that the buy signal after a GLB is intact as long as the stock closes repeatedly above the green line. So we will learn this week if it continues to be a tradable GLB and closes only above 63.44.

Screenshot

The GMI remains at 5 (of 6).