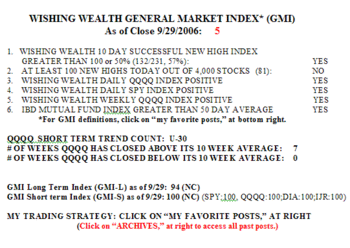
The GMI fell one, to +5 on Friday because there were only 81 new yearly highs in my universe of 4,000 stocks.  But the GMI-S remains at 100, indicating considerable strength in my short term indicators for four major stock indexes. Only 30% of the Nasdaq 100 stocks rose on Friday, along with 42% of the S&P500 stocks and 53% of the Dow 30 stocks. Friday was the 30th day in the QQQQ current up-trend and the index has closed above its 10 week average for seven straight weeks. It has been a good time to be long the QQQQ (or QLD) and tech stocks. On the other hand, the mutual fund end-of-quarter window dressing is over and the beginning of October may be soft. Volume should be light on Monday with the Jewish New Year. It may take Tuesday for this market to reveal the current short term trend.
I created a new watchlist containing the IBD 100 list published on Monday. Would you believe that the current list includes only 28 stocks that were on the list from 5/16 and 46 of the stocks on the list on 8/14. In other words, 72% of the IBD 100 stocks on 5/16 were replaced, as were 54% of the stocks on the list on 8/14. How can IBD continually compare the IBD 100 stock index with the S&P 500 index, when the IBD 100 list changes so much? The IBD 100 stock list continually drops off the poor performing stocks and is, thus, incredibly unstable. The valid way to look at IBD 100 stock performance is to look at how the same list of stocks performed over time. Thus, only 23% of the stocks on the list on 5/16 closed higher on Friday than they closed on 5/16. And 49% of the stocks on the list on 8/14 closed higher Friday than on 8/14. In contrast, 44% of the Nasdaq 100 stocks closed higher on Friday than they did on 5/16 and 87% of them closed higher on Friday than on 8/14. The Nasdaq 100 stocks greatly out-performed the IBD 100 stocks during these two periods. It does not appear to be a good idea to run out and buy stocks just because they appear on the IBD 100 list.
Please send your comments to: silentknight@wishingwealthblog.com.
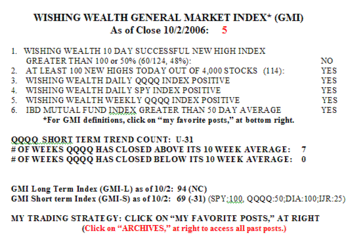
 But there were 114 new highs in my universe of 4,000 stocks. 26-43% of the stocks in the Nasdaq 100, S&P500 and Dow 30 stocks rose on Monday. Only 27 of the 100 stocks in the new IBD 100 list posted on 10/2 advanced. So again the IBD 100 stocks underperformed the stocks in the major indexes. Seven of the IBD 100 stocks did hit a new high on Monday: TNL, GYMB, PHLY, ENR, LIFC, PRFT, and SYX. Monday was the 31st day in the QQQQ up-trend, which is still intact. Hopefully, a weak Ocotber will set up a nice end of year rally.
