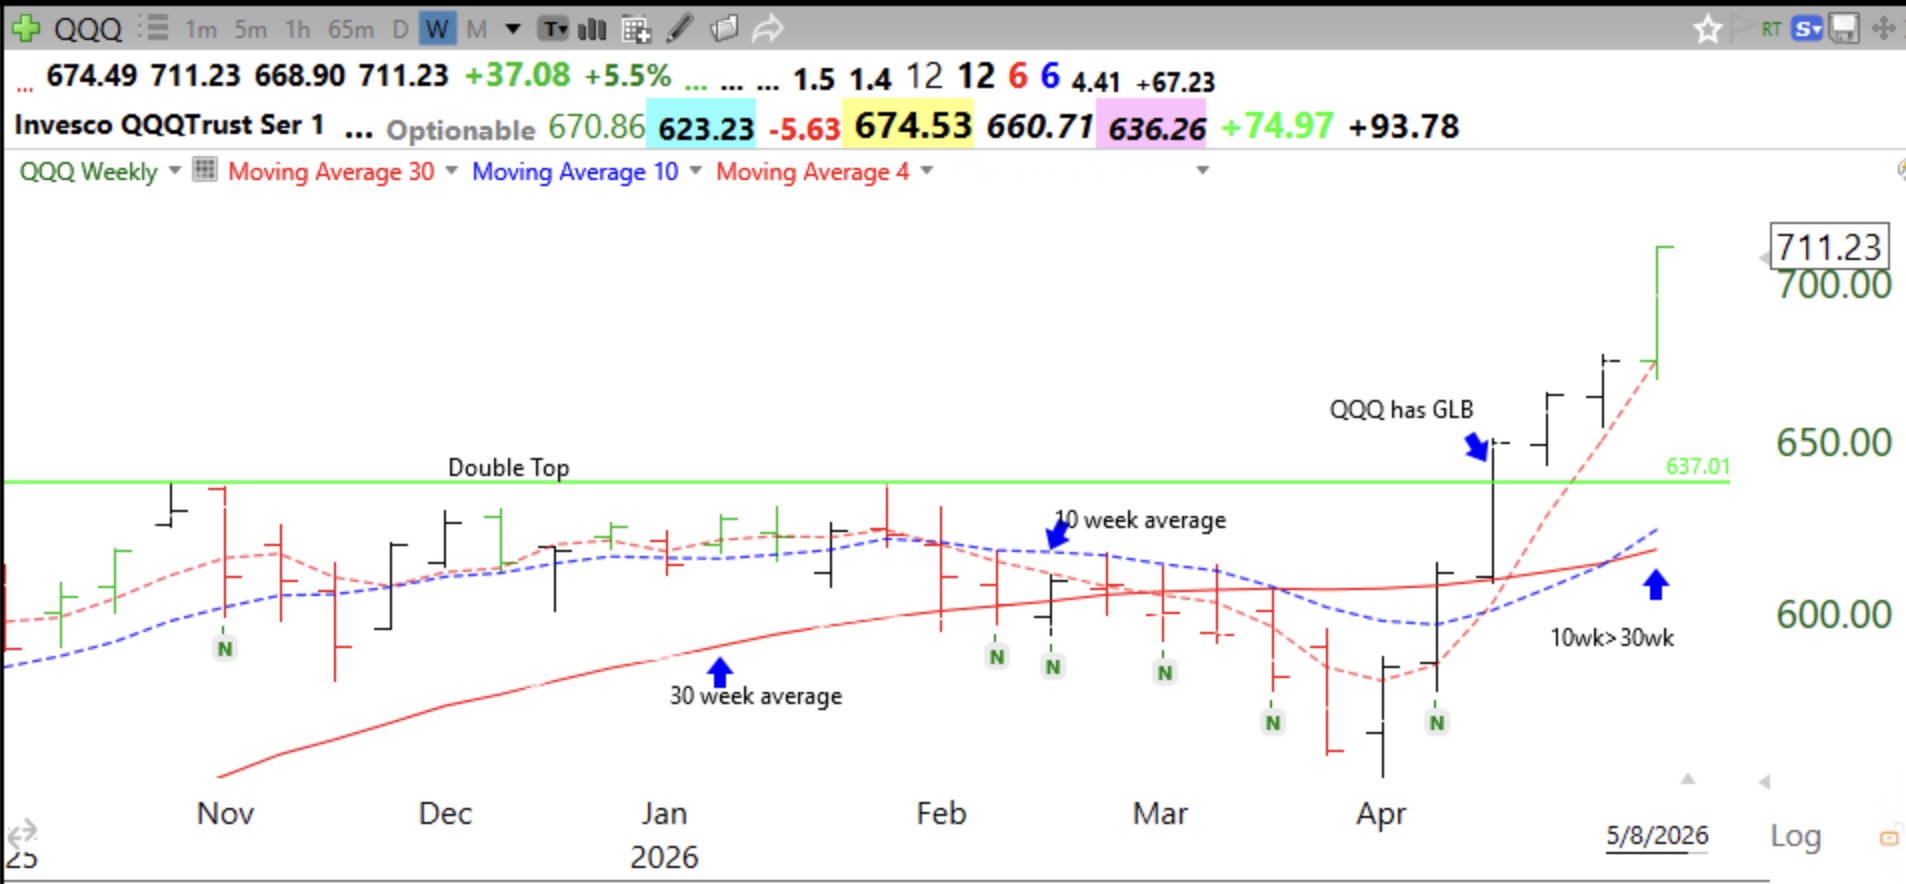
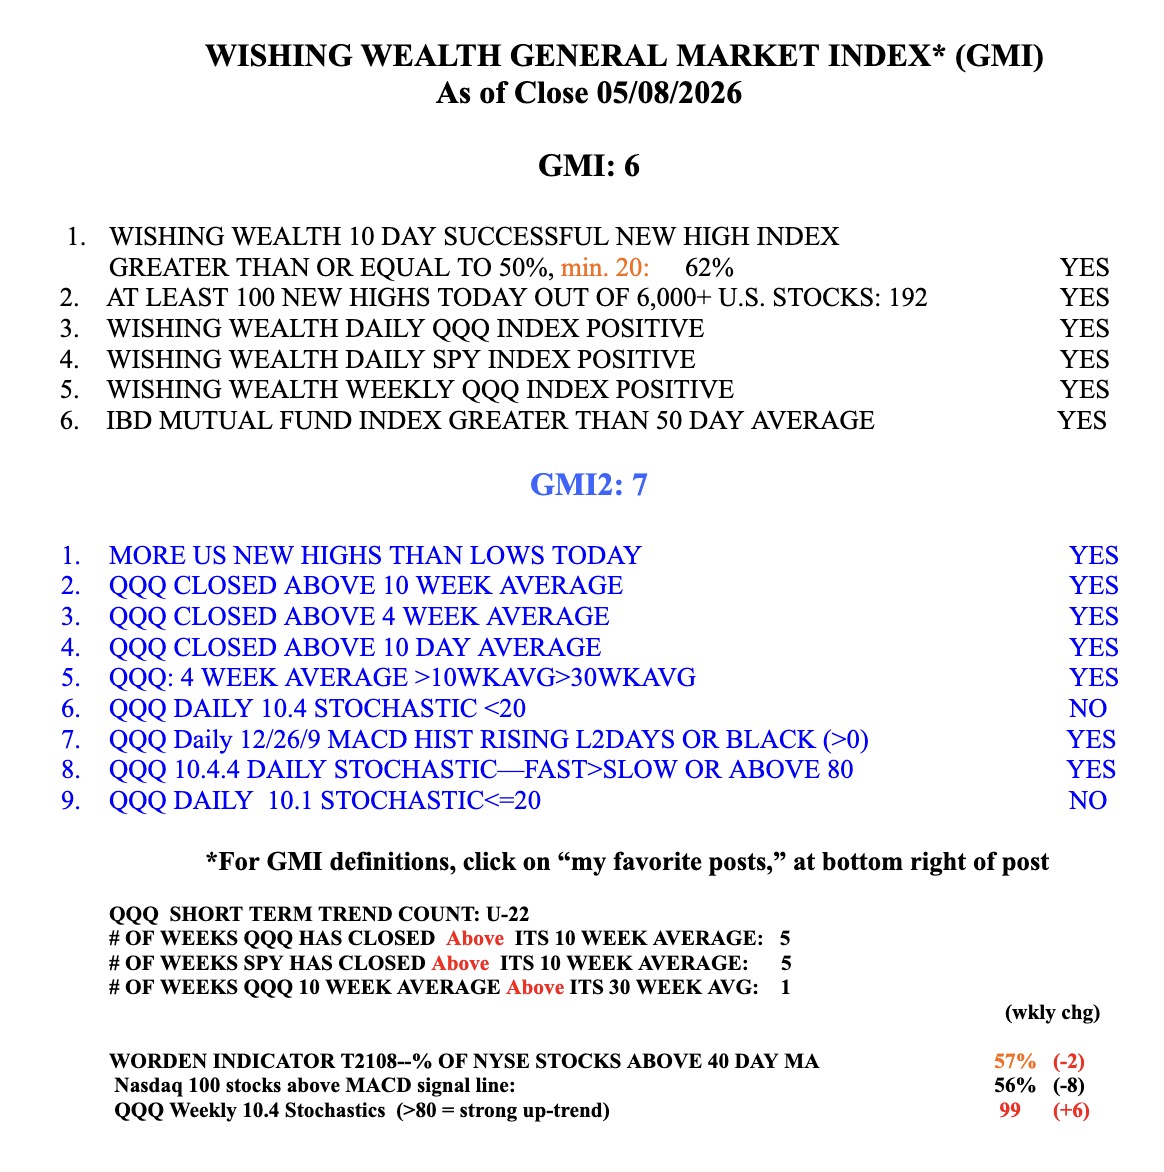
The 10 week average is finally back above its 30 week average and 4wk>10wk>30 wk, 4wk avg=red dotted line. This is a powerful up-trend to ride. However, because QQQ closed the week so far above its 4wk average, I would not be surprised to see this week some retracement to kiss the 4 wk average, currently around 675. That would be a potential buy point for me.
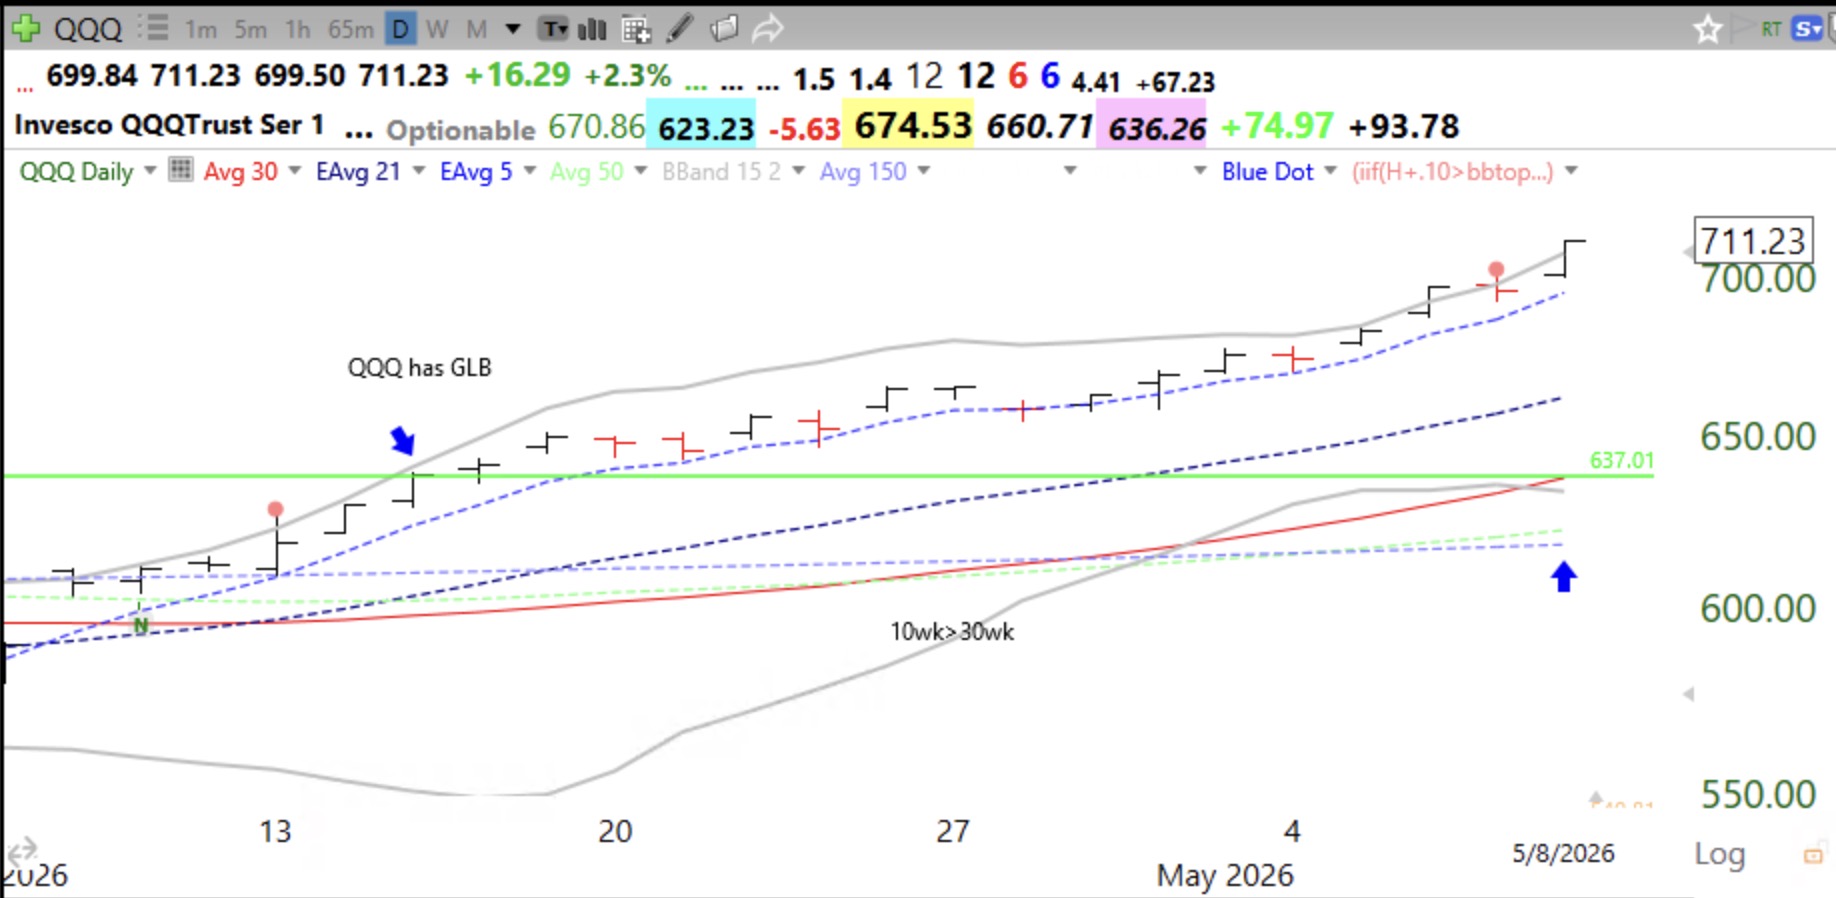
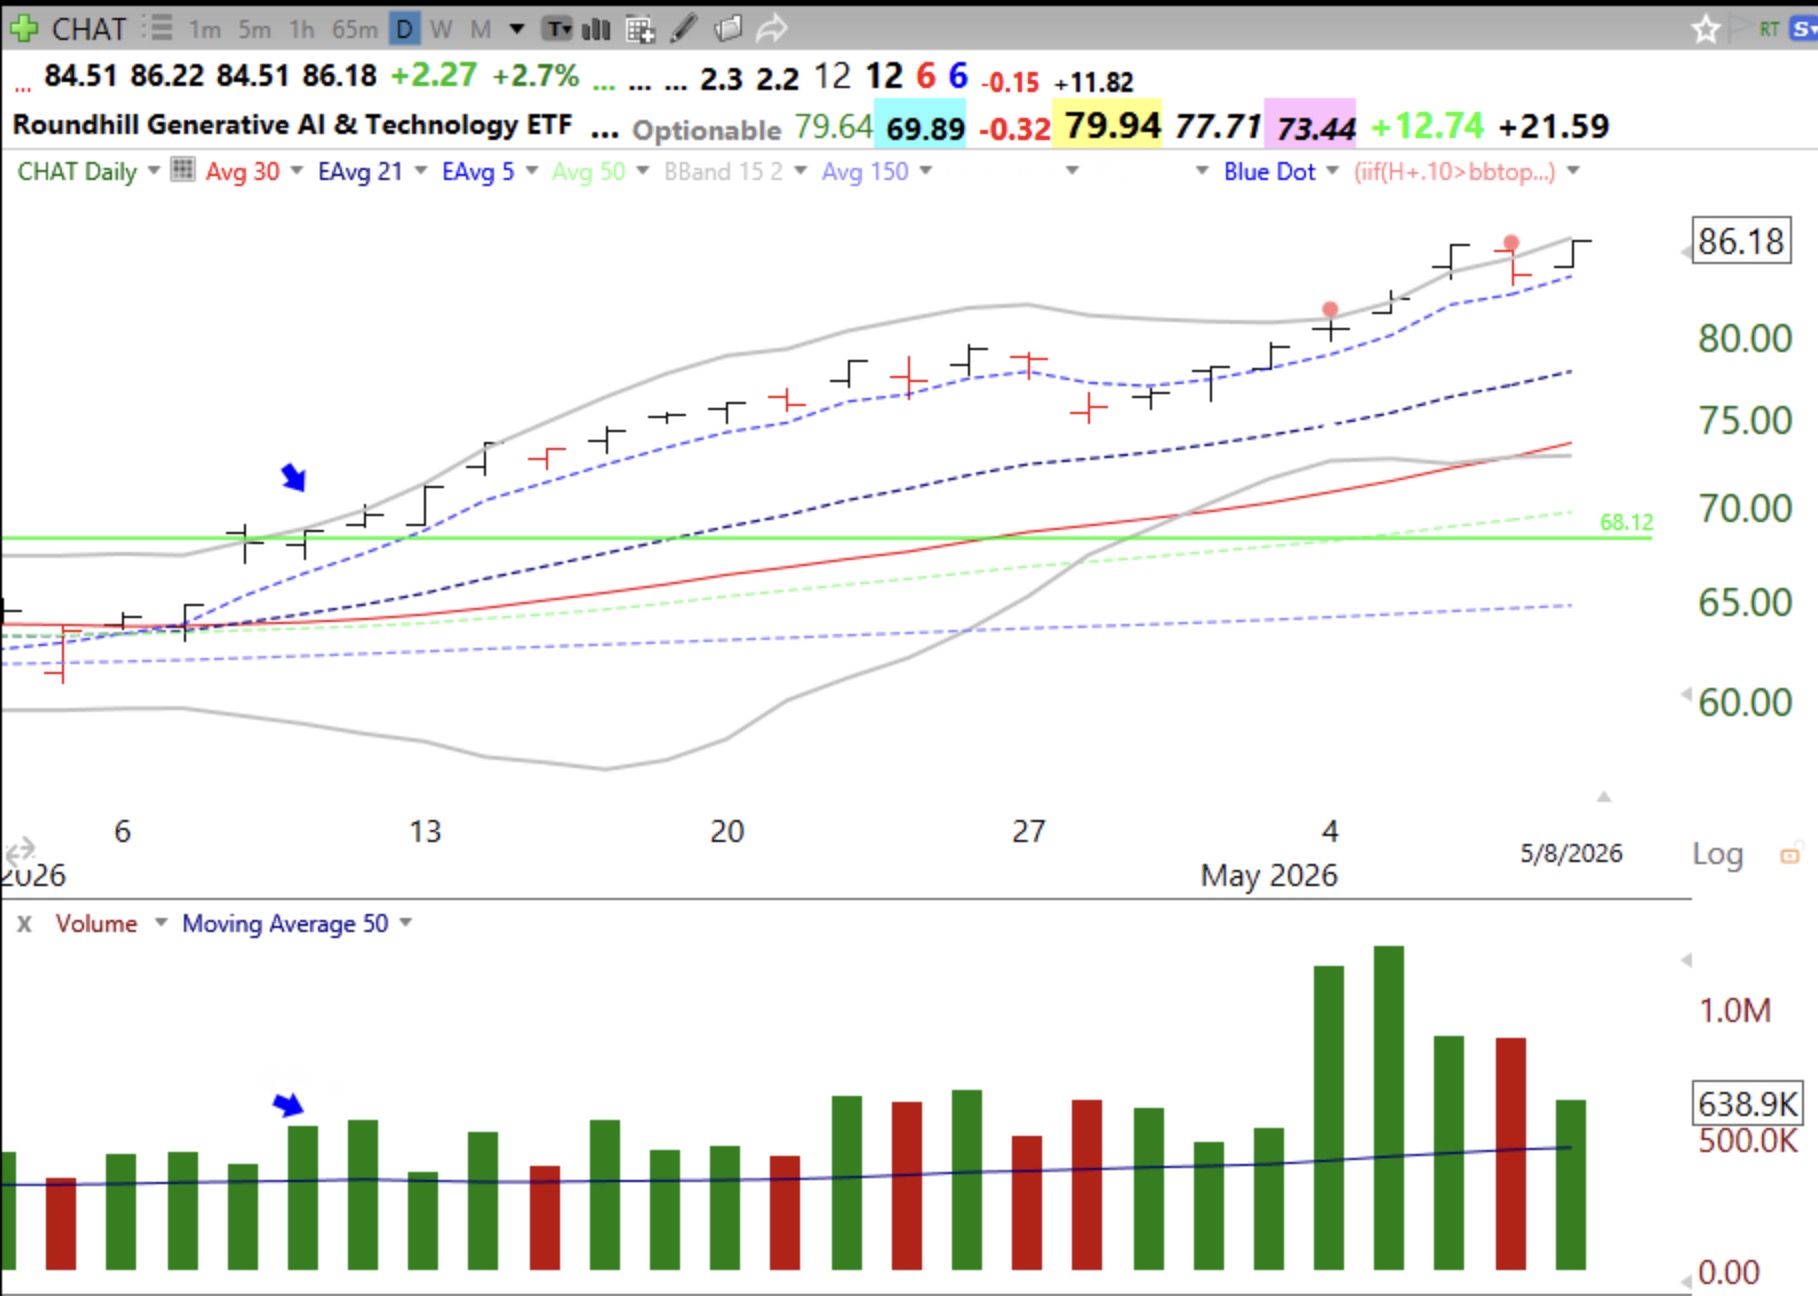
Meanwhile, there has been some nice successful GLBs. INTC had a high volume GLB and has then trended along its 5 day exponential moving average (EMA). Even QQQ has been doing so.
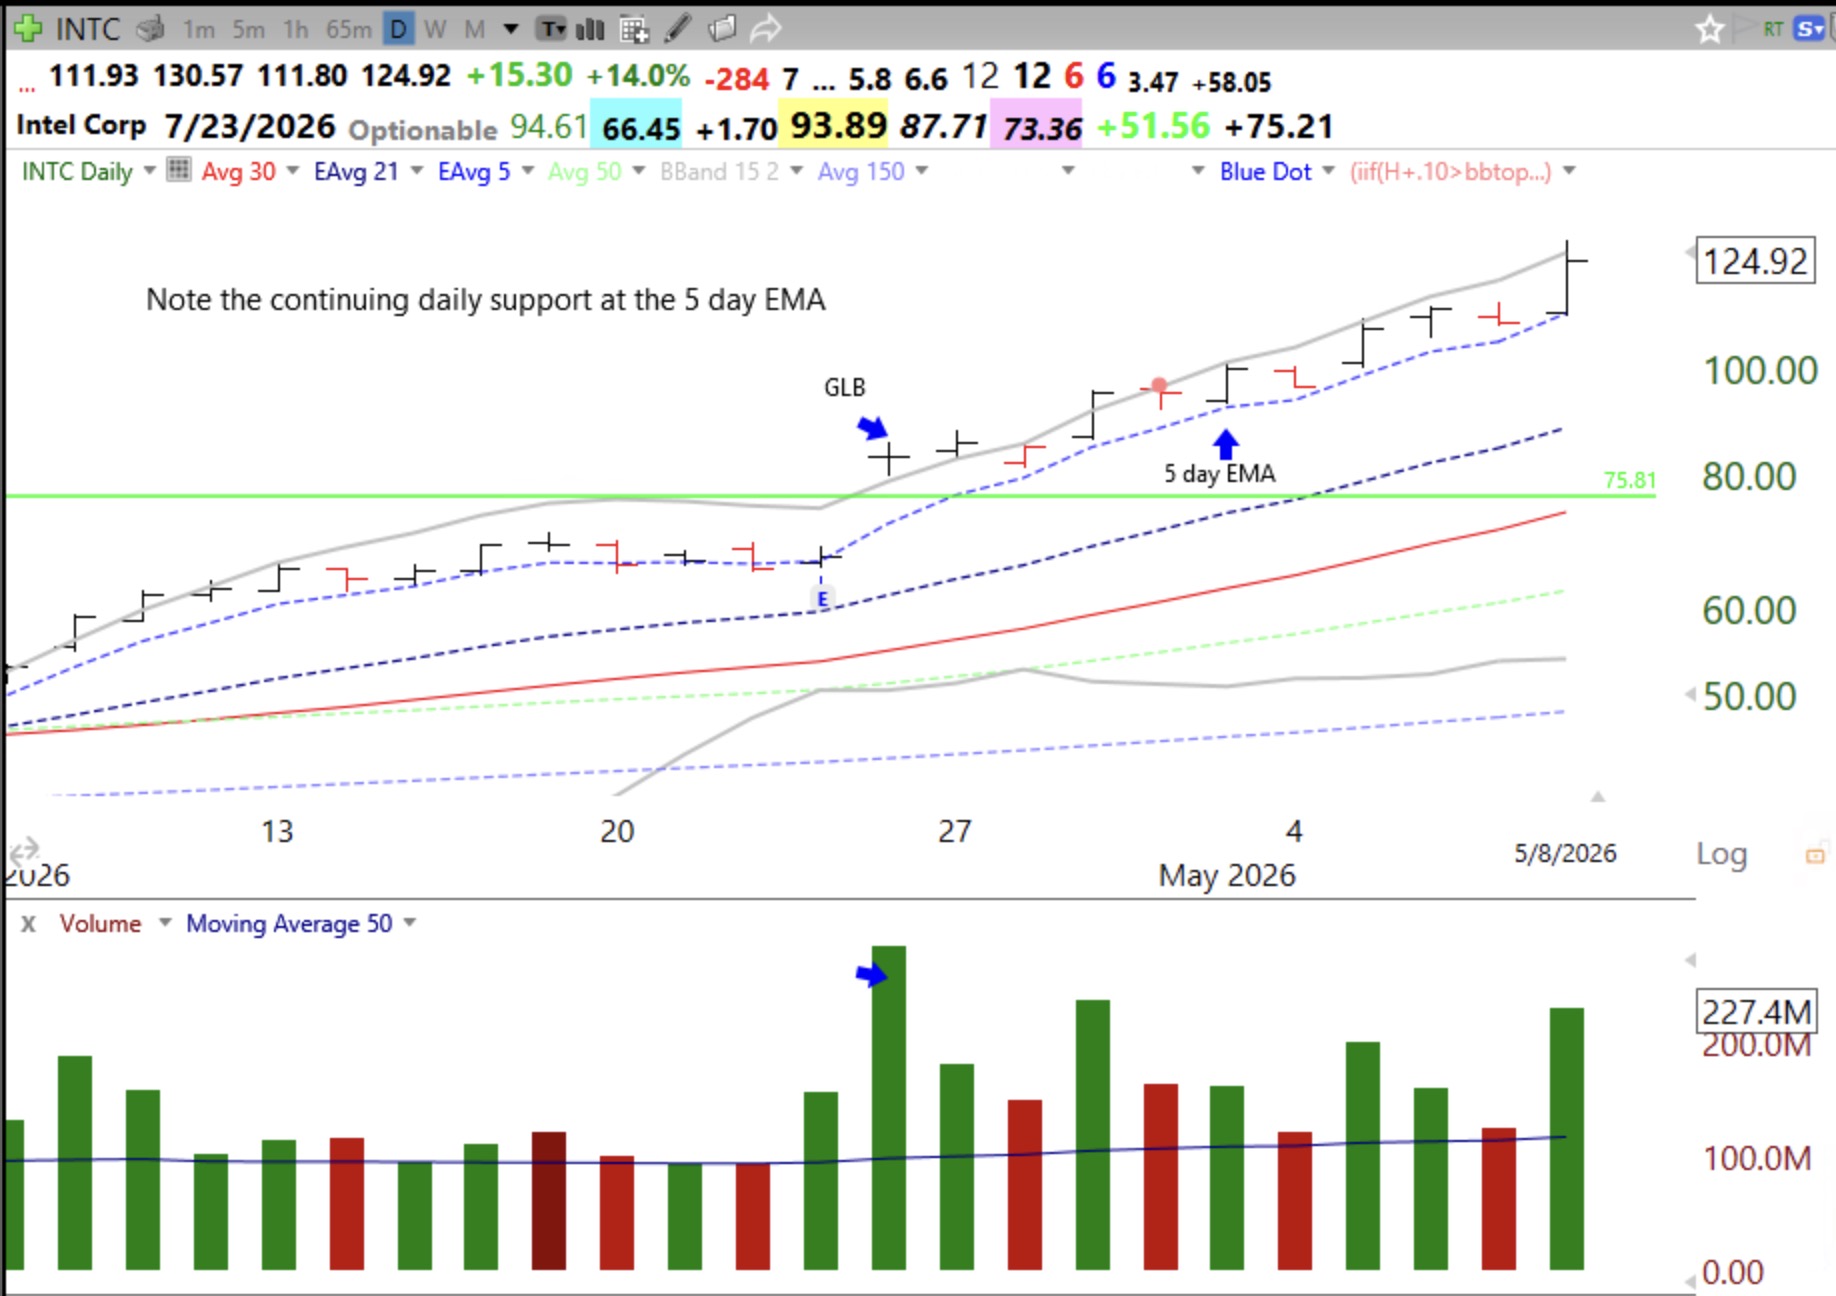
One way to trade a GLB is to find one trending along its 5 day EMA. When it closes below it, I may place a sell stop below that day’s low.
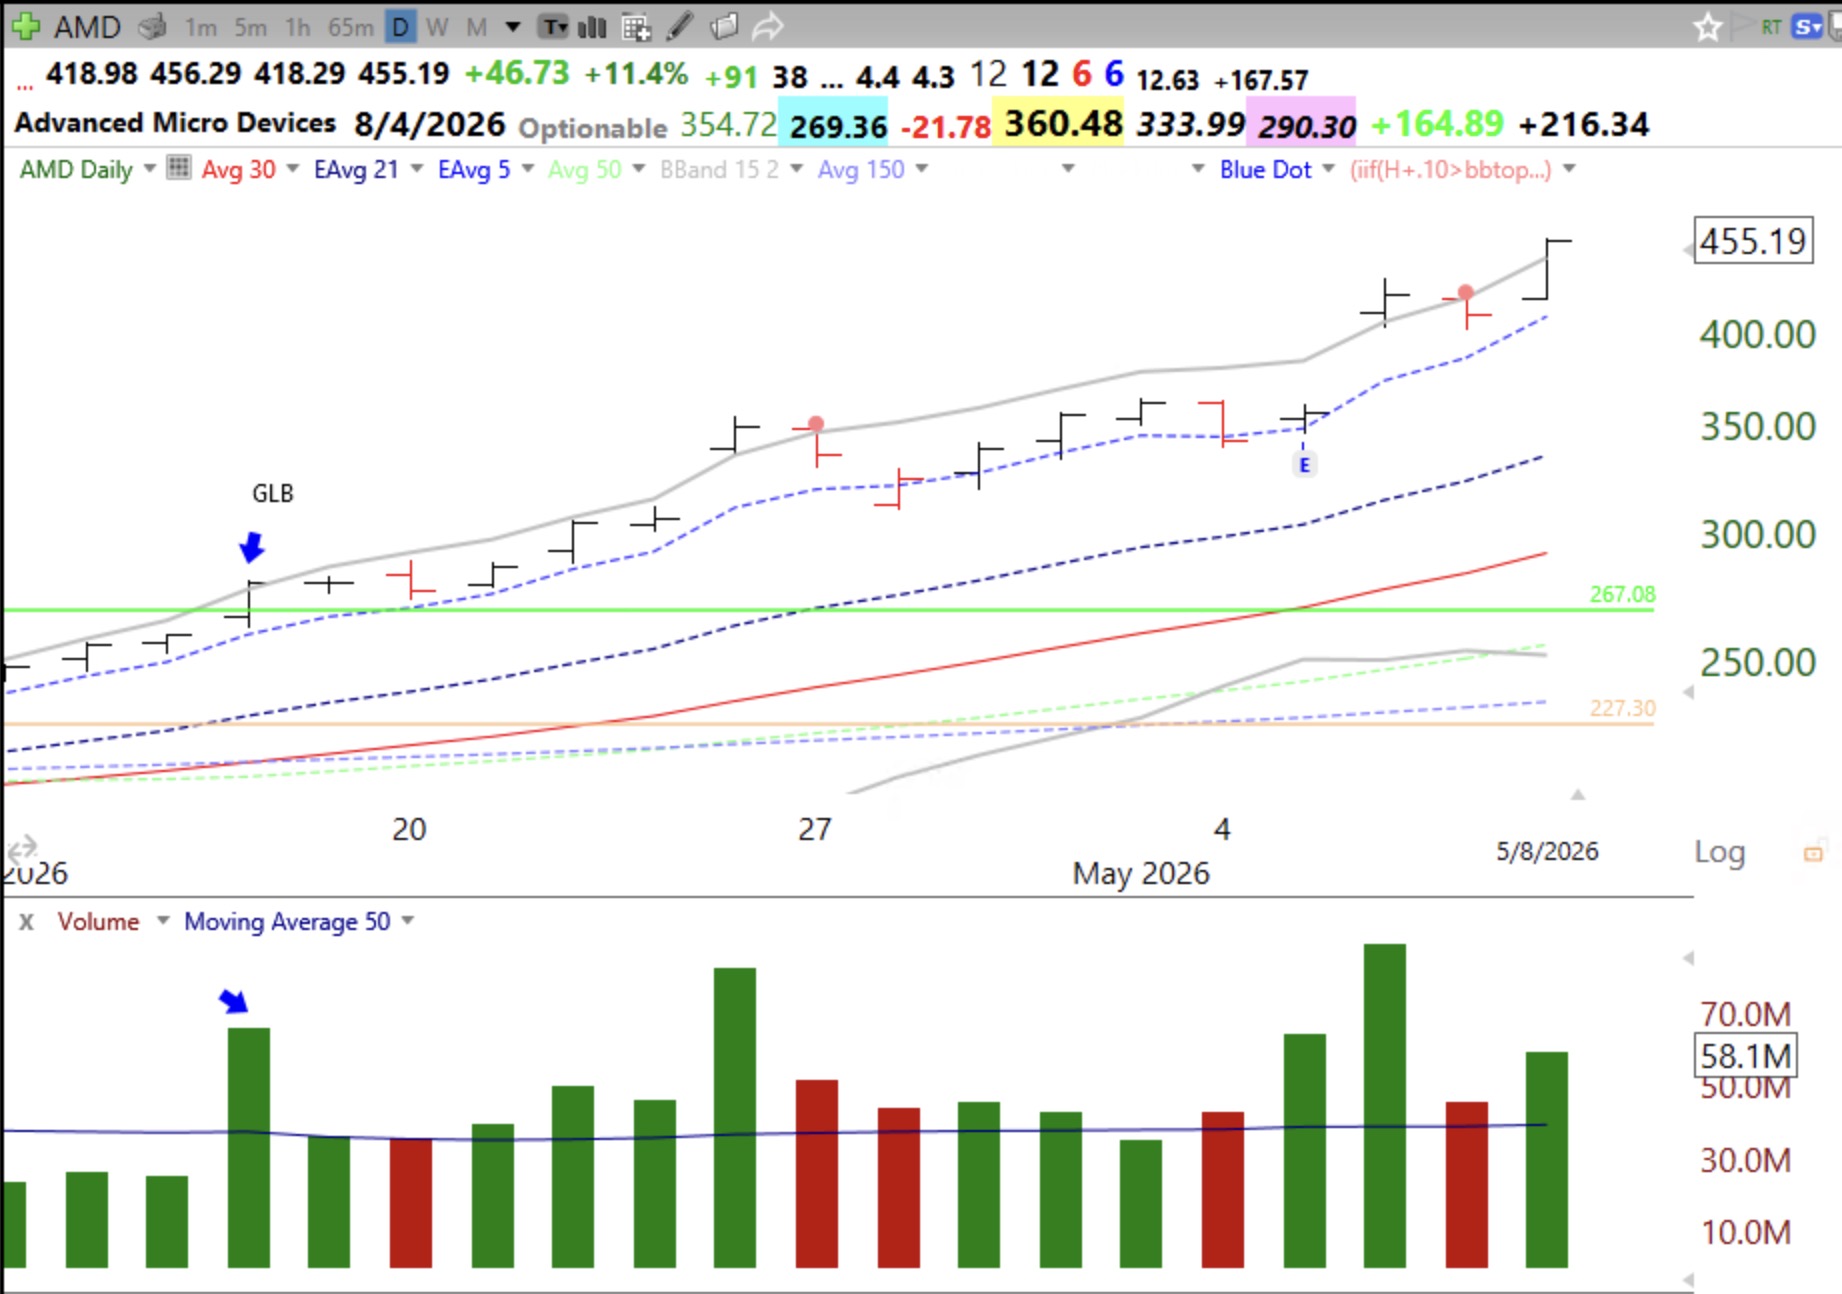
GLBs are also powerful for ETFs. Note the one close below the 5 day EMA. If I had placed a stop below that day’s low I would have retained the position.
The GMI= GREEN. It is amazing how well GLBs have been working! Check out my recent MoneyShow presentation, link on the Webinars tab of this blog, to understand how I find and trade GLBs using TC2000. Get a discount coupon for TC2000 on the blog header too and find your own!
Eric, is there an easy way to plug some of your EasyScan screen formulas into TC2000? For instance, do you have a code for each of the scans listed in your glossary that I can cut and paste into TC2000? I just purchased TC2000. thx. -glenn