Next Tuesday at 7 PM I will present to the Eastern Michigan AAII group. Register here free.
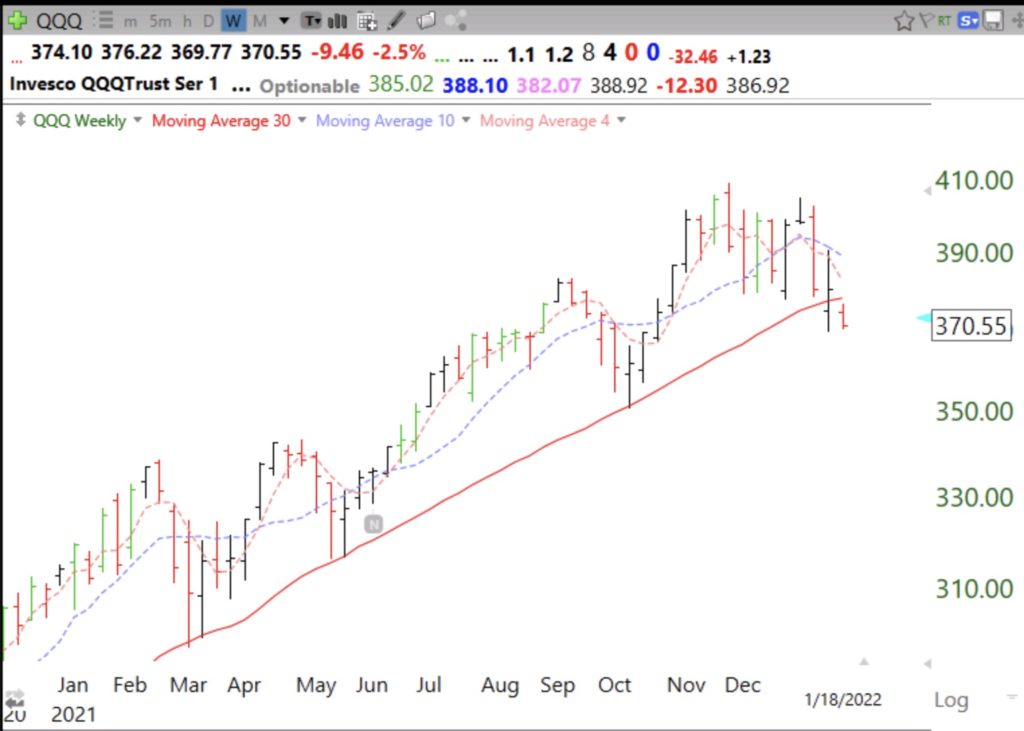
As bad as things look, the real decline may be yet to come. Below is the weekly chart of QQQ. When/if the 30 week average (red solid line) turns down it would signal to me the beginning of a significant Stage IV decline. That signal is what got me out of the market in 2000, 2008 and 2020 near the beginning of the drop. But often times the indexes bounce around this average before everything sinks. It takes a while for the buy the bargains on the dip crowd to give up. I am already mainly in cash in all of my accounts. I began lightening up in November, as I wrote then.