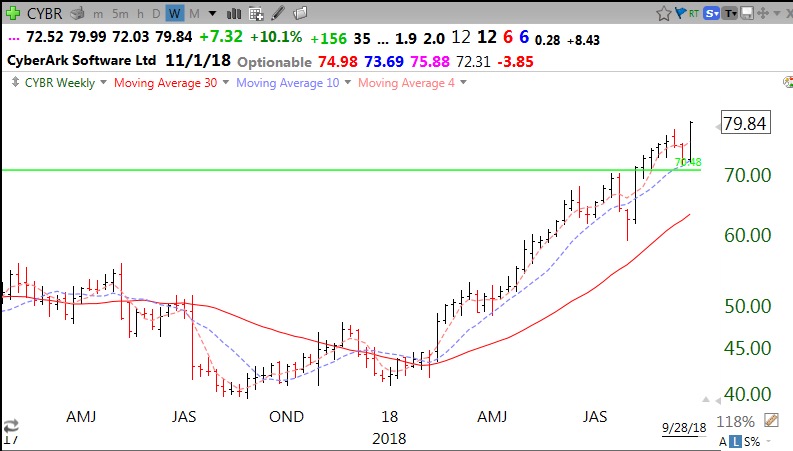
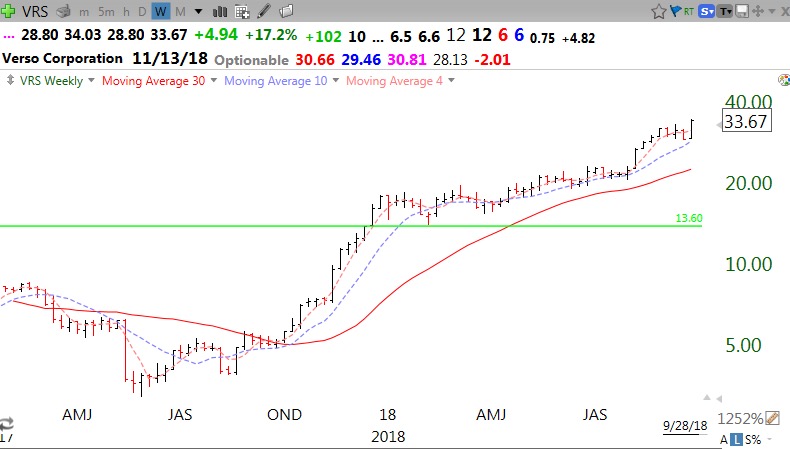
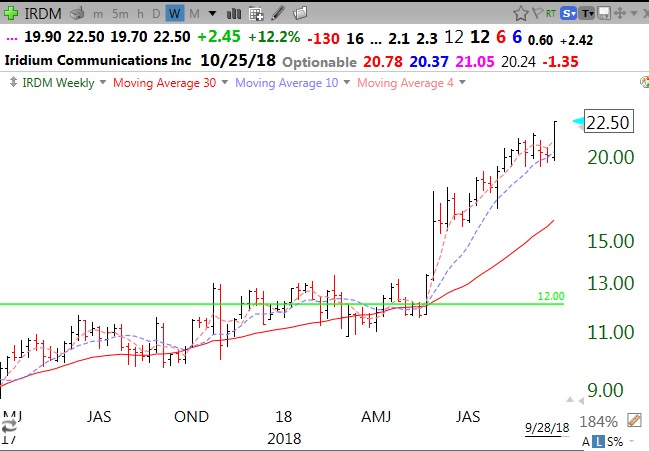
One of the set-ups I am teaching my students this semester is to buy growth stocks above their last green line top (ATH not exceeded for at least 3 months) that has bounced up off of (or close to) their 10 week average. The 10 week average (blue dotted line) must be rising above its 30 week average (solid red line). Once buying the stock on this set-up, they must place their initial hard or mental stop loss below the low of the week of the bounce. The idea is to buy a strong stock and hold it until the 10 week average is violated at a weekly close. Twelve stocks hitting an ATH (all-time high) on Friday met these criteria as of Friday’s close. Here are three of their weekly charts. The first two have recent earnings increases above 100% and all have already at least doubled over the past year–a sign of strength.
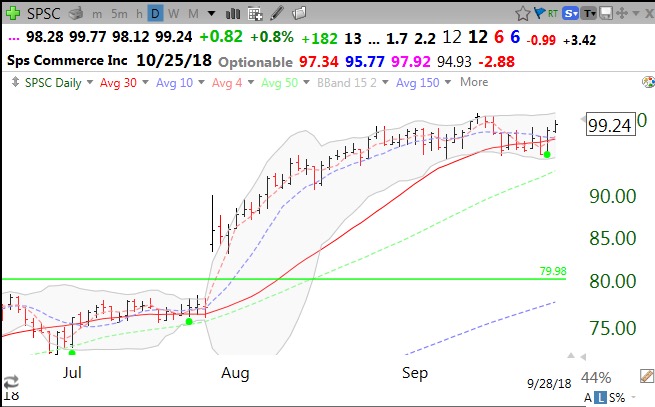
A few other stocks that did not reach an ATH on Friday but have doubled the past year and bounced their 10 week average last week include: TRHC, NSP, ZEN, BJRI, EVBG, LPSN, RNG, SPSC. SPSC hit all of my favorite set-ups, including a green dot, last week. Here is its daily chart:
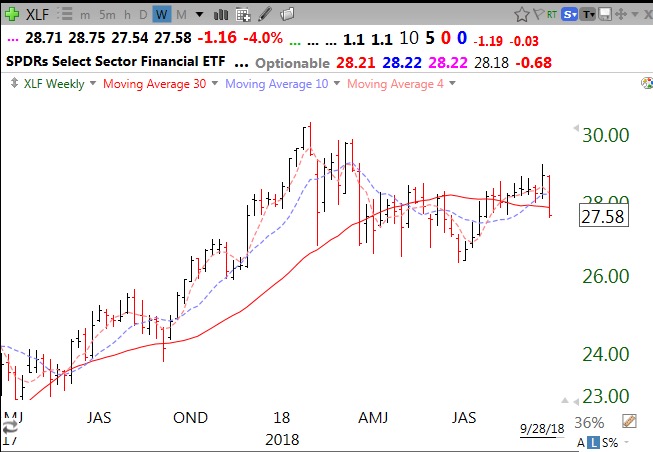
We came through the typically weakest month of the market, September, unscathed. There are some warning signs, though. There were more new lows than highs on Wednesday through Friday and the strong tech stocks are masking the weakness in much of the rest of the market. The health stocks are also surging (CURE (3x ETF), HUM, HIIQ, UNH, MOH, CNC, WCG). But the financial stocks look weak. In fact, this weekly chart of the financial ETF, XLF, shows it may be entering a Stage 4 decline–very ominous and worth monitoring. If the hikes in interest rates don’t help the banks to prosper, it may be telegraphing tough times to come.
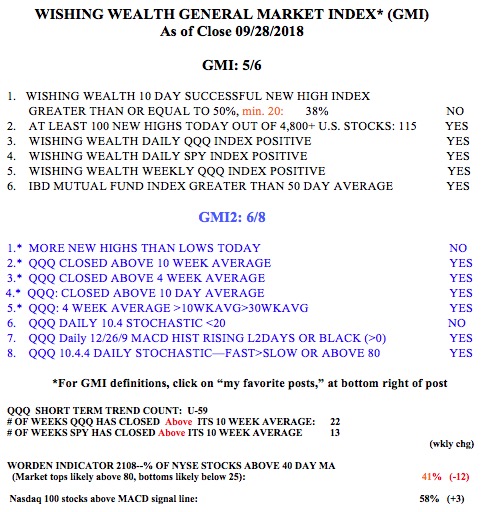
But the GMI remains on a Green signal–for now.
