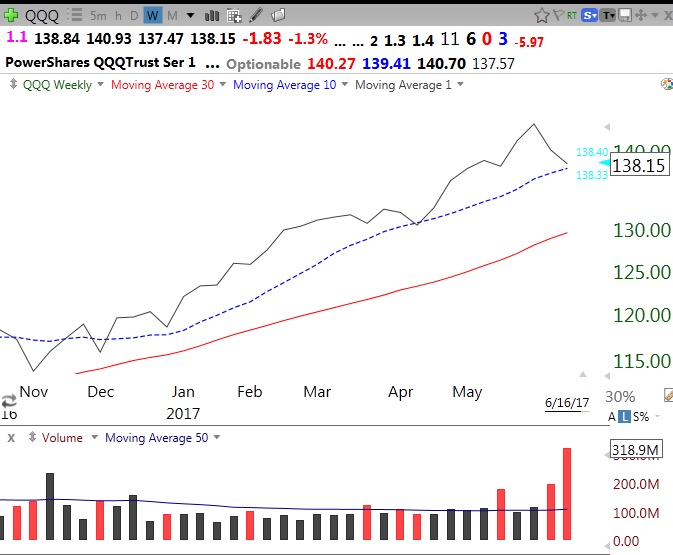
The weekly chart below shows the QQQ has, with one small exception in April, not closed a week below its 10 week average (blue dotted line). The 10 week average has in turn been rising well above the 30 week average (red line). This is a strong pattern I have been monitoring since the 90’s when I discovered it and named it the “Yellow Band” pattern. In those days I would draw a band with a yellow highlighter in the empty white space between the 10 and 30 week averages. Hence the name. As long as the QQQ closes this week above the 10 week average (currently 137.57), the bullish pattern will be maintained. This week is a critical week because of the 3 weeks of very heavy down volume, shown by the red volume spikes. Recently, the heavy volume down weeks have overshadowed the volume on up weeks, a possible sign of distribution by the institutions. A bounce up off of the 10 week average would be a very bullish sign to me.
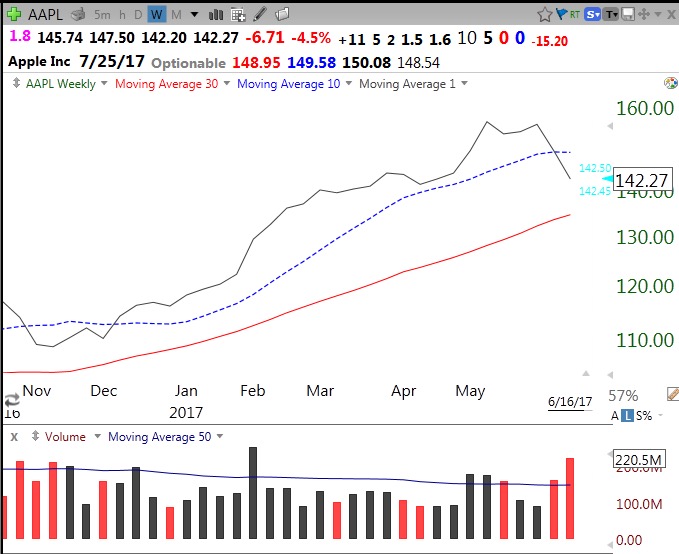
One reason why I think the QQQ may fail is this weekly chart of AAPL, which has already violated its 10 week average on above average volume. Apple’s Yellow Band pattern is over, for now.
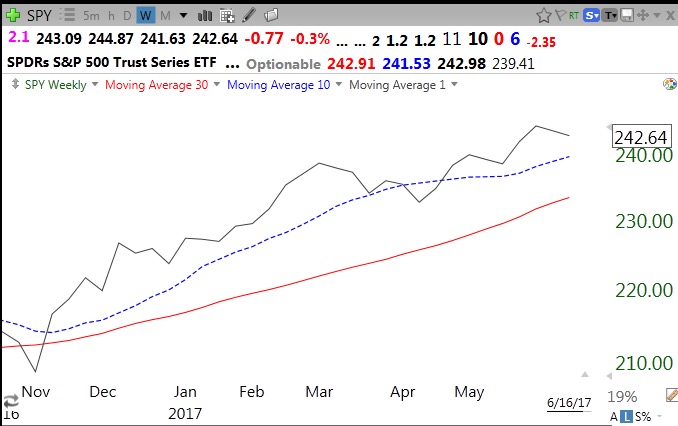
The SPY is holding up much better.
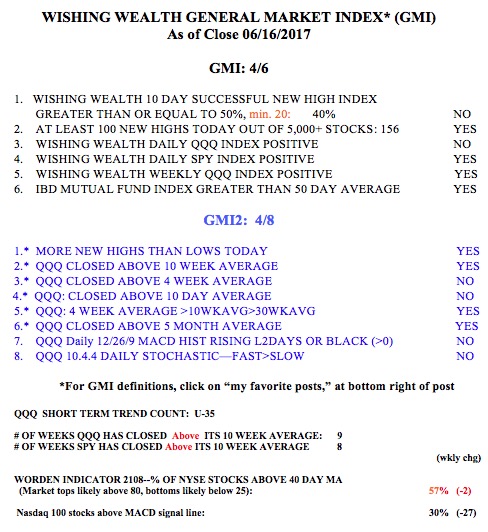
The GMI remains at 4 (of 6) and still on a Green signal.